
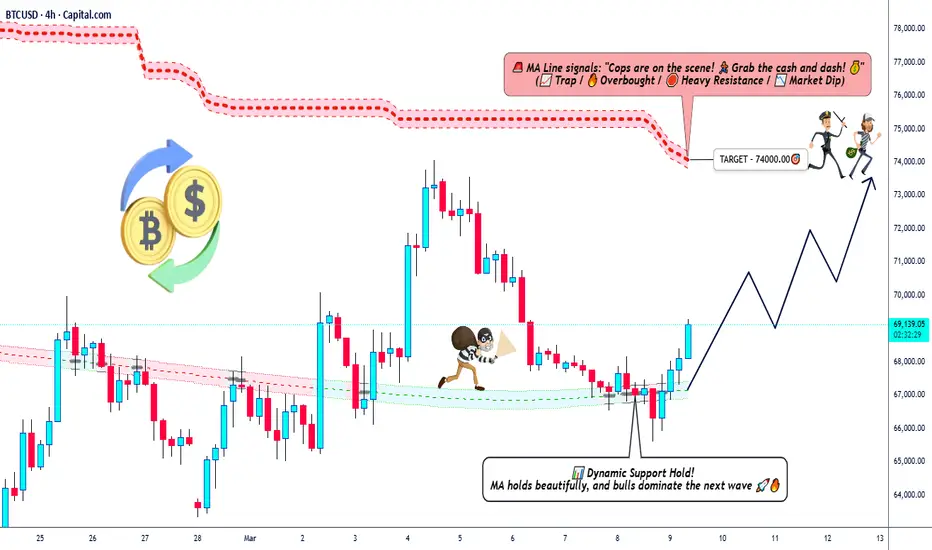
🚀 BTC/USDT — BITCOIN vs TETHER
Crypto Market Profit Pathway Setup | Day / Swing Trade
Asset: BTC/USDT — Bitcoin vs Tether
Market: Cryptocurrency
Trading Style: Day / Swing Trade
Directional Bias: 📈 Bullish Plan
🧭 Trade Plan Overview
Bitcoin continues to show institutional accumulation signals after defending major demand zones. Market structure suggests that liquidity is being built for a potential continuation move.
This setup focuses on trend continuation with volatility expansion after consolidation.
Entry:
Traders may consider entries based on their own preferred price level, confirmation candle, or liquidity sweep setup.
⚠️ Always wait for confirmation from your own strategy.
🎯 Target Projection
Primary Target: $74,000
Reasons behind the target zone:
• The moving average cluster above price often acts like a “market police force,” creating strong resistance zones.
• Current structure indicates a possible liquidity trap for late buyers near resistance.
• Correlation signals suggest the market may push toward liquidity above recent highs before distribution.
💡 Smart traders may scale profits around liquidity pools near the 74K zone.
🛑 Risk Management
Stop Loss (Thief SL): $65,000
This level represents a structural invalidation zone where bullish market structure would weaken.
⚠️ Important note:
This stop loss is only part of the analysis idea. Risk management is always your personal decision.
Trade smart. Protect capital first.
🌐 Macro & Fundamental Drivers (Latest Market Context)
Several macroeconomic and geopolitical factors are currently influencing Bitcoin price behavior:
🏦 Federal Reserve Policy
Interest rate expectations and liquidity conditions remain the largest macro drivers for crypto markets. If inflation remains elevated, tighter monetary policy may limit Bitcoin’s upside.
💵 US Dollar Index (DXY)
Bitcoin often moves inversely to the U.S. Dollar Index. When the dollar strengthens, crypto assets tend to face downward pressure.
📊 Risk-Asset Correlation
Bitcoin frequently behaves like a high-beta risk asset similar to tech stocks, showing correlation with major indices like Nasdaq during liquidity cycles.
🌍 Geopolitical & Macro Volatility
Recent geopolitical tensions and macro uncertainty have increased volatility, while Bitcoin recently pushed toward the $73K–$74K area during risk-on sentiment shifts.
📅 Upcoming Economic Catalysts
Watch these macro events carefully:
• US CPI Inflation Data
• Federal Reserve Rate Decision
• US Employment Data (NFP)
• Global liquidity conditions
These events can create high-impact volatility spikes in BTC.
🔗 Correlated Markets to Watch
Monitoring related markets helps confirm trade direction.
💲 Crypto Market Pairs
• BTC/USDT – Primary market structure
• ETH/USDT – Ethereum momentum confirmation
• TOTAL Crypto Market Cap – Institutional flow indicator
📉 Macro Correlation Assets
• DXY (US Dollar Index) → Strong dollar may pressure BTC
• NASDAQ / US100 → Risk-on sentiment boosts crypto
• Gold (XAU/USD) → Competes as alternative store of value
💡 When NASDAQ rises and DXY falls, Bitcoin tends to perform strongly.
📊 Technical Observations
Key structural observations from the chart:
• Liquidity resting above recent highs
• Moving average resistance cluster
• Possible trap formation near overbought conditions
• Institutional accumulation below key support zones
This environment often creates fake breakouts before real moves.
Patience is a trader’s edge.
🧠 Professional Trading Reminder
Markets reward discipline, patience, and risk control.
Never chase price.
Let the market come to your plan.
💎 Thief Trader Mindset
“Liquidity is the real treasure.
Smart traders don't chase price —
they wait where the money hides.”
and
“The market doesn't reward speed.
It rewards patience and precision.”
👍 If you find this analysis helpful:
• Hit Boost 🚀
• Drop a Like 👍
• Share your market view in the comments
Let's grow together in the markets.
Crypto Market Profit Pathway Setup | Day / Swing Trade
Asset: BTC/USDT — Bitcoin vs Tether
Market: Cryptocurrency
Trading Style: Day / Swing Trade
Directional Bias: 📈 Bullish Plan
🧭 Trade Plan Overview
Bitcoin continues to show institutional accumulation signals after defending major demand zones. Market structure suggests that liquidity is being built for a potential continuation move.
This setup focuses on trend continuation with volatility expansion after consolidation.
Entry:
Traders may consider entries based on their own preferred price level, confirmation candle, or liquidity sweep setup.
⚠️ Always wait for confirmation from your own strategy.
🎯 Target Projection
Primary Target: $74,000
Reasons behind the target zone:
• The moving average cluster above price often acts like a “market police force,” creating strong resistance zones.
• Current structure indicates a possible liquidity trap for late buyers near resistance.
• Correlation signals suggest the market may push toward liquidity above recent highs before distribution.
💡 Smart traders may scale profits around liquidity pools near the 74K zone.
🛑 Risk Management
Stop Loss (Thief SL): $65,000
This level represents a structural invalidation zone where bullish market structure would weaken.
⚠️ Important note:
This stop loss is only part of the analysis idea. Risk management is always your personal decision.
Trade smart. Protect capital first.
🌐 Macro & Fundamental Drivers (Latest Market Context)
Several macroeconomic and geopolitical factors are currently influencing Bitcoin price behavior:
🏦 Federal Reserve Policy
Interest rate expectations and liquidity conditions remain the largest macro drivers for crypto markets. If inflation remains elevated, tighter monetary policy may limit Bitcoin’s upside.
💵 US Dollar Index (DXY)
Bitcoin often moves inversely to the U.S. Dollar Index. When the dollar strengthens, crypto assets tend to face downward pressure.
📊 Risk-Asset Correlation
Bitcoin frequently behaves like a high-beta risk asset similar to tech stocks, showing correlation with major indices like Nasdaq during liquidity cycles.
🌍 Geopolitical & Macro Volatility
Recent geopolitical tensions and macro uncertainty have increased volatility, while Bitcoin recently pushed toward the $73K–$74K area during risk-on sentiment shifts.
📅 Upcoming Economic Catalysts
Watch these macro events carefully:
• US CPI Inflation Data
• Federal Reserve Rate Decision
• US Employment Data (NFP)
• Global liquidity conditions
These events can create high-impact volatility spikes in BTC.
🔗 Correlated Markets to Watch
Monitoring related markets helps confirm trade direction.
💲 Crypto Market Pairs
• BTC/USDT – Primary market structure
• ETH/USDT – Ethereum momentum confirmation
• TOTAL Crypto Market Cap – Institutional flow indicator
📉 Macro Correlation Assets
• DXY (US Dollar Index) → Strong dollar may pressure BTC
• NASDAQ / US100 → Risk-on sentiment boosts crypto
• Gold (XAU/USD) → Competes as alternative store of value
💡 When NASDAQ rises and DXY falls, Bitcoin tends to perform strongly.
📊 Technical Observations
Key structural observations from the chart:
• Liquidity resting above recent highs
• Moving average resistance cluster
• Possible trap formation near overbought conditions
• Institutional accumulation below key support zones
This environment often creates fake breakouts before real moves.
Patience is a trader’s edge.
🧠 Professional Trading Reminder
Markets reward discipline, patience, and risk control.
Never chase price.
Let the market come to your plan.
💎 Thief Trader Mindset
“Liquidity is the real treasure.
Smart traders don't chase price —
they wait where the money hides.”
and
“The market doesn't reward speed.
It rewards patience and precision.”
👍 If you find this analysis helpful:
• Hit Boost 🚀
• Drop a Like 👍
• Share your market view in the comments
Let's grow together in the markets.

Haftungsausschluss
Die Informationen und Veröffentlichungen sind nicht als Finanz-, Anlage-, Handels- oder andere Arten von Ratschlägen oder Empfehlungen gedacht, die von TradingView bereitgestellt oder gebilligt werden, und stellen diese nicht dar. Lesen Sie mehr in den Nutzungsbedingungen.
Haftungsausschluss
Die Informationen und Veröffentlichungen sind nicht als Finanz-, Anlage-, Handels- oder andere Arten von Ratschlägen oder Empfehlungen gedacht, die von TradingView bereitgestellt oder gebilligt werden, und stellen diese nicht dar. Lesen Sie mehr in den Nutzungsbedingungen.