
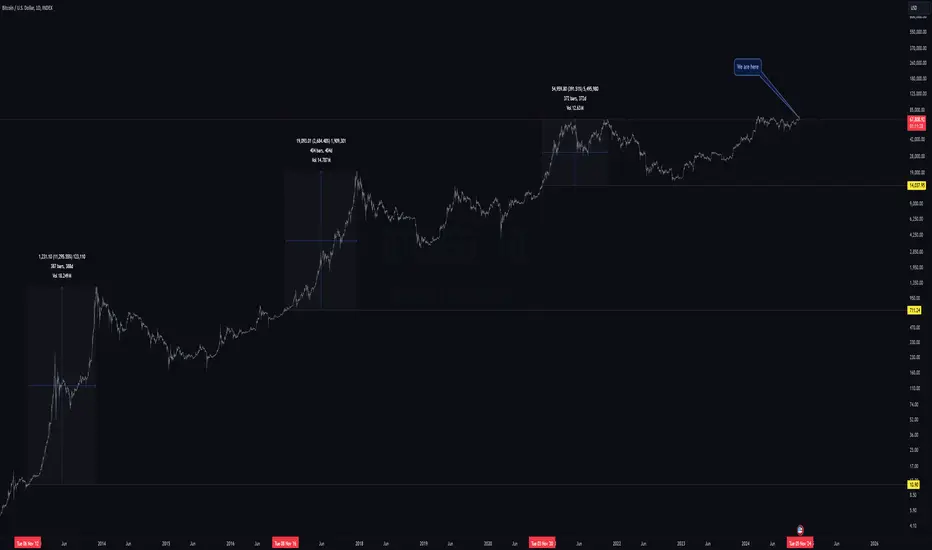
This charts the dates of the previous three US Elections (2012, 2016 and 2020) on a log chart, with price on the horizontal axis at daily candle close.
As you can see, once price breaks above (sometimes next day, as in 2020, sometimes a week or more later, as in 2016 and in 2012) price has never returned - ever.
Plotted are the time and percentage difference from election date to cycle ATH. On average it's 387 days apart.
If things play out this time in a similar fashion we can expect this week into mid next week to be the final time BTC will be in the mid 60k per coin - ever.
As you can see, once price breaks above (sometimes next day, as in 2020, sometimes a week or more later, as in 2016 and in 2012) price has never returned - ever.
Plotted are the time and percentage difference from election date to cycle ATH. On average it's 387 days apart.
If things play out this time in a similar fashion we can expect this week into mid next week to be the final time BTC will be in the mid 60k per coin - ever.

Haftungsausschluss
Die Informationen und Veröffentlichungen sind nicht als Finanz-, Anlage-, Handels- oder andere Arten von Ratschlägen oder Empfehlungen gedacht, die von TradingView bereitgestellt oder gebilligt werden, und stellen diese nicht dar. Lesen Sie mehr in den Nutzungsbedingungen.
Haftungsausschluss
Die Informationen und Veröffentlichungen sind nicht als Finanz-, Anlage-, Handels- oder andere Arten von Ratschlägen oder Empfehlungen gedacht, die von TradingView bereitgestellt oder gebilligt werden, und stellen diese nicht dar. Lesen Sie mehr in den Nutzungsbedingungen.