
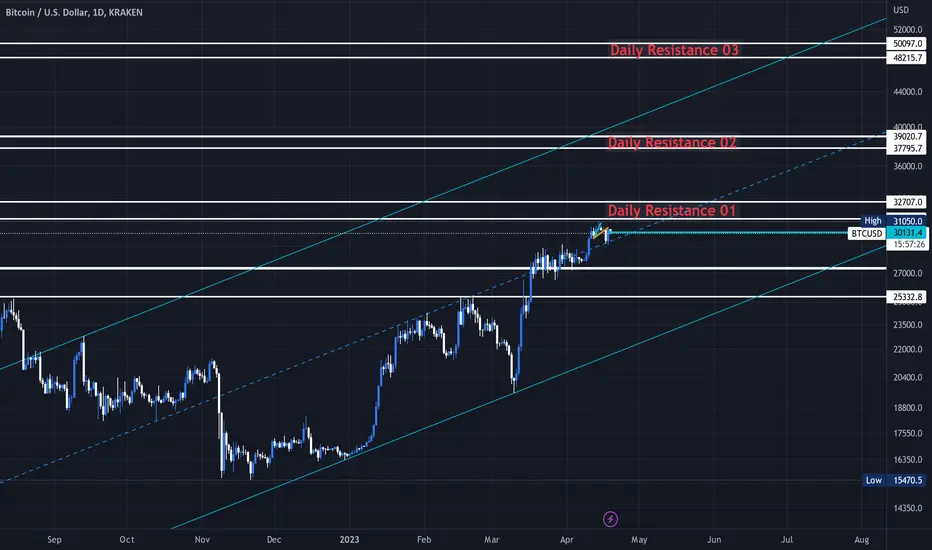
#Btc | #Analyse | 1D | #NUM_A24
Bitcoin is in a bullish channel on the daily time frame
Currently, the midline of the support channel and a strong daily static resistance is located in the region of 32707~31245.
The daily momentum is upward and the trend is also upward
As we said in the previous analysis
If the price rises to the resistance areas that we specified in the chart, you can look for sales setups

Haftungsausschluss
Die Informationen und Veröffentlichungen sind nicht als Finanz-, Anlage-, Handels- oder andere Arten von Ratschlägen oder Empfehlungen gedacht, die von TradingView bereitgestellt oder gebilligt werden, und stellen diese nicht dar. Lesen Sie mehr in den Nutzungsbedingungen.
Haftungsausschluss
Die Informationen und Veröffentlichungen sind nicht als Finanz-, Anlage-, Handels- oder andere Arten von Ratschlägen oder Empfehlungen gedacht, die von TradingView bereitgestellt oder gebilligt werden, und stellen diese nicht dar. Lesen Sie mehr in den Nutzungsbedingungen.