
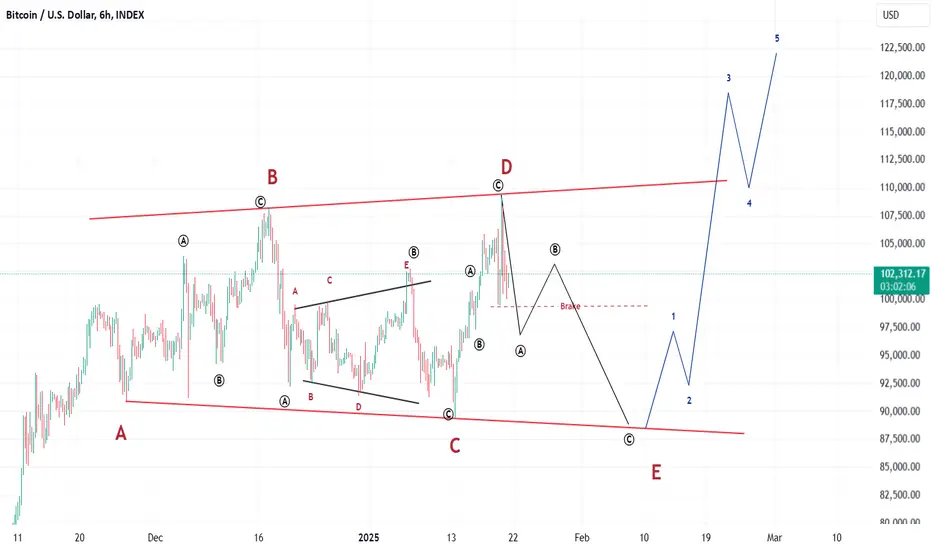
BTC peaked on November 23 and then entered a sideways corrective formation.
The corrective formation is called a reverse triangle, and it is characterized by the following features:
Three consecutive lower bottoms (A-B-C)
Two consecutive higher tops (B-D)
With the potential completion of the E bottom of the triangle, we can take a buy position on a lower timeframe if we identify a reversal pattern at the bottoms.
The initial target is a new all-time high.
The corrective formation is called a reverse triangle, and it is characterized by the following features:
Three consecutive lower bottoms (A-B-C)
Two consecutive higher tops (B-D)
With the potential completion of the E bottom of the triangle, we can take a buy position on a lower timeframe if we identify a reversal pattern at the bottoms.
The initial target is a new all-time high.

Haftungsausschluss
Die Informationen und Veröffentlichungen sind nicht als Finanz-, Anlage-, Handels- oder andere Arten von Ratschlägen oder Empfehlungen gedacht, die von TradingView bereitgestellt oder gebilligt werden, und stellen diese nicht dar. Lesen Sie mehr in den Nutzungsbedingungen.
Haftungsausschluss
Die Informationen und Veröffentlichungen sind nicht als Finanz-, Anlage-, Handels- oder andere Arten von Ratschlägen oder Empfehlungen gedacht, die von TradingView bereitgestellt oder gebilligt werden, und stellen diese nicht dar. Lesen Sie mehr in den Nutzungsbedingungen.