
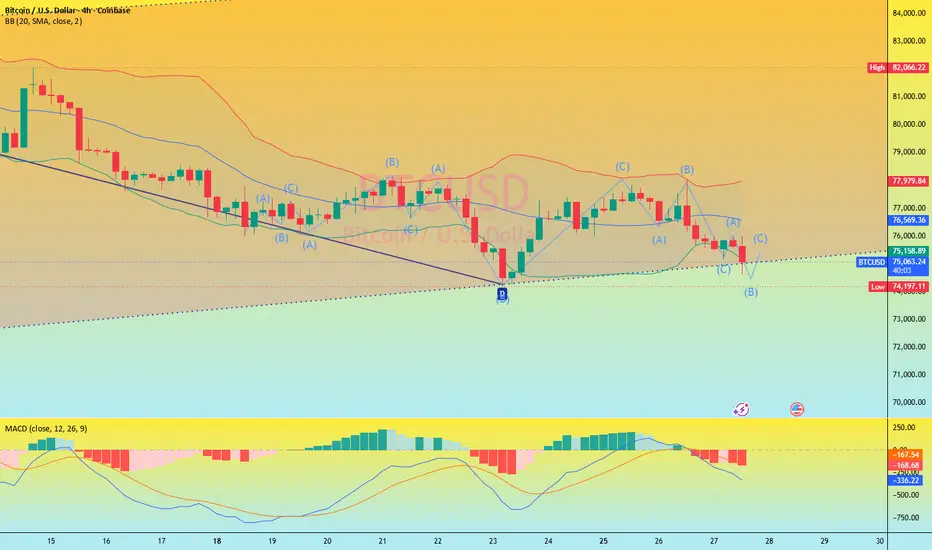
The liquidation heatmap shows a significant concentration of short leveraged positions between $77,200 and $78,900, with noticeable liquidity around $80,000 and $81,000. Further down, large liquidation pools are observed around $74,000 and the $72,000-$73,000 area.
This suggests that if the price fails to recover the upper liquidity zone, the market may continue to test support levels. If the price falls below $74,000, the next area of focus will shift to approximately $71,700-$68,900.
This suggests that if the price fails to recover the upper liquidity zone, the market may continue to test support levels. If the price falls below $74,000, the next area of focus will shift to approximately $71,700-$68,900.
Anmerkung
Accurate signals are the only way for you to reap wealth. Anmerkung
For real-time and detailed signals, please join the free signal area or leave a message.Anmerkung
Best of luck to all traders.
Haftungsausschluss
Die Informationen und Veröffentlichungen sind nicht als Finanz-, Anlage-, Handels- oder andere Arten von Ratschlägen oder Empfehlungen gedacht, die von TradingView bereitgestellt oder gebilligt werden, und stellen diese nicht dar. Lesen Sie mehr in den Nutzungsbedingungen.
Haftungsausschluss
Die Informationen und Veröffentlichungen sind nicht als Finanz-, Anlage-, Handels- oder andere Arten von Ratschlägen oder Empfehlungen gedacht, die von TradingView bereitgestellt oder gebilligt werden, und stellen diese nicht dar. Lesen Sie mehr in den Nutzungsbedingungen.