
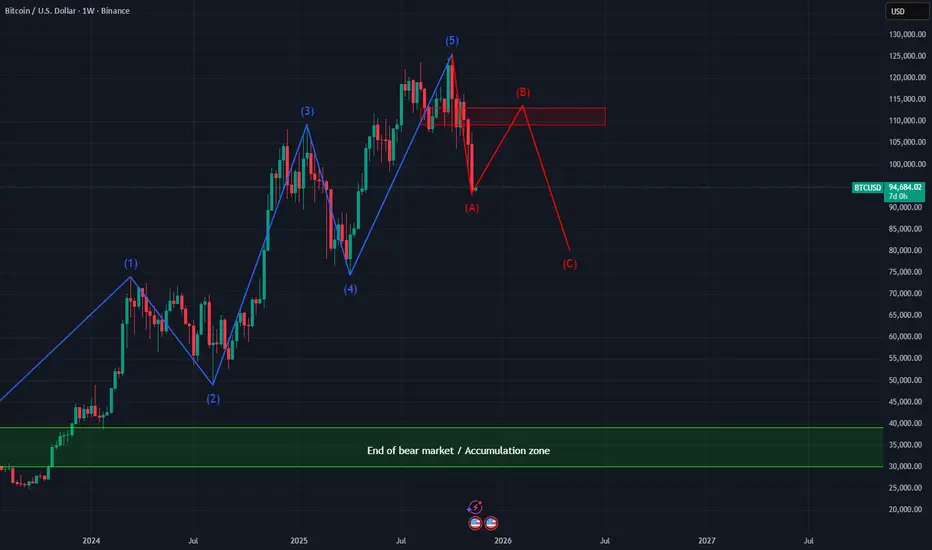
I had to wait until the weekly closing candle to publish this idea.
We are currently in the A wave correction. I am expecting the price to do the B wave now (couple of weeks or the time it takes), finding resistance between 109,286 and 113,174 resistance zone. That zone will be where I place my Big Short with a TP of 40,000.
40,000 - 30,000 will be the accumulation zone and will mean the end of the bear market. When the time comes, I will tell you when the bull market begins and the next ATH in BTC.
Don't buy BTC at these prices, it is too expensive, wait for the next couple of years to buy. I will update the Daily chart idea for the big short zone to have the precise entry point.
We are currently in the A wave correction. I am expecting the price to do the B wave now (couple of weeks or the time it takes), finding resistance between 109,286 and 113,174 resistance zone. That zone will be where I place my Big Short with a TP of 40,000.
40,000 - 30,000 will be the accumulation zone and will mean the end of the bear market. When the time comes, I will tell you when the bull market begins and the next ATH in BTC.
Don't buy BTC at these prices, it is too expensive, wait for the next couple of years to buy. I will update the Daily chart idea for the big short zone to have the precise entry point.

Verbundene Veröffentlichungen
Haftungsausschluss
Die Informationen und Veröffentlichungen sind nicht als Finanz-, Anlage-, Handels- oder andere Arten von Ratschlägen oder Empfehlungen gedacht, die von TradingView bereitgestellt oder gebilligt werden, und stellen diese nicht dar. Lesen Sie mehr in den Nutzungsbedingungen.
Verbundene Veröffentlichungen
Haftungsausschluss
Die Informationen und Veröffentlichungen sind nicht als Finanz-, Anlage-, Handels- oder andere Arten von Ratschlägen oder Empfehlungen gedacht, die von TradingView bereitgestellt oder gebilligt werden, und stellen diese nicht dar. Lesen Sie mehr in den Nutzungsbedingungen.