Lately I’ve been seeing a ton of large accounts calling for a
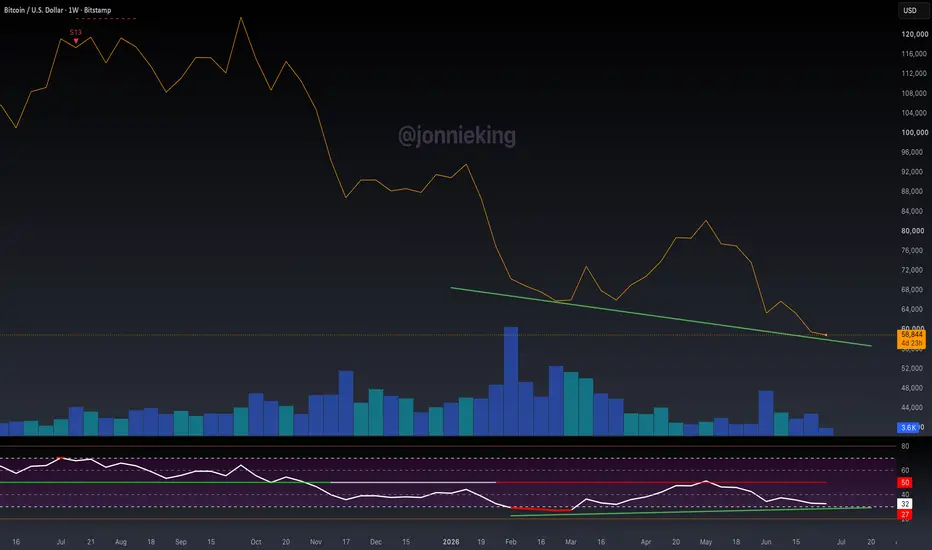
 BTC bottom because of the extremely weak bullish divergence on the Weekly chart.
This means absolutely nothing without confluence from PA, volume and other indicators-- all which are horrendous, such as volume which you can clearly see.
If PA keeps going lower, the bull div goes away, along with this silly bull-slop.
Example:
Low #1: BTC = $65,200 RSI = 27
Low #2 (today): BTC = $58,500 RSI = 32
That's a bullish RSI divergence because price made a lower low while RSI made a higher low.
But if ₿itcoin keeps falling...
Low #3: BTC = $54,000 RSI = 25
The divergence is invalidated because RSI made a lower low (25 < 27).
Bullish divergences aren't permanent. They can disappear if price and RSI continue making new lows before reversing.
The important threshold isn't the price, it's the RSI.
As long as BTC keeps making lower lows while RSI stays above ~27, the bullish divergence remains intact. If a future weekly low pushes RSI below that prior low, the divergence is no longer valid.
Please be careful with the financial advice you take from people on X and YouTube. Most of these people have very little experience with technical analysis and just shill you bull-slop for clicks.
BTC bottom because of the extremely weak bullish divergence on the Weekly chart.This means absolutely nothing without confluence from PA, volume and other indicators-- all which are horrendous, such as volume which you can clearly see.
If PA keeps going lower, the bull div goes away, along with this silly bull-slop.
Example:
Low #1: BTC = $65,200 RSI = 27
Low #2 (today): BTC = $58,500 RSI = 32
That's a bullish RSI divergence because price made a lower low while RSI made a higher low.
But if ₿itcoin keeps falling...
Low #3: BTC = $54,000 RSI = 25
The divergence is invalidated because RSI made a lower low (25 < 27).
Bullish divergences aren't permanent. They can disappear if price and RSI continue making new lows before reversing.
The important threshold isn't the price, it's the RSI.
As long as BTC keeps making lower lows while RSI stays above ~27, the bullish divergence remains intact. If a future weekly low pushes RSI below that prior low, the divergence is no longer valid.
Please be careful with the financial advice you take from people on X and YouTube. Most of these people have very little experience with technical analysis and just shill you bull-slop for clicks.

Haftungsausschluss
Die Informationen und Veröffentlichungen sind nicht als Finanz-, Anlage-, Handels- oder andere Arten von Ratschlägen oder Empfehlungen gedacht, die von TradingView bereitgestellt oder gebilligt werden, und stellen diese nicht dar. Lesen Sie mehr in den Nutzungsbedingungen.
Haftungsausschluss
Die Informationen und Veröffentlichungen sind nicht als Finanz-, Anlage-, Handels- oder andere Arten von Ratschlägen oder Empfehlungen gedacht, die von TradingView bereitgestellt oder gebilligt werden, und stellen diese nicht dar. Lesen Sie mehr in den Nutzungsbedingungen.