
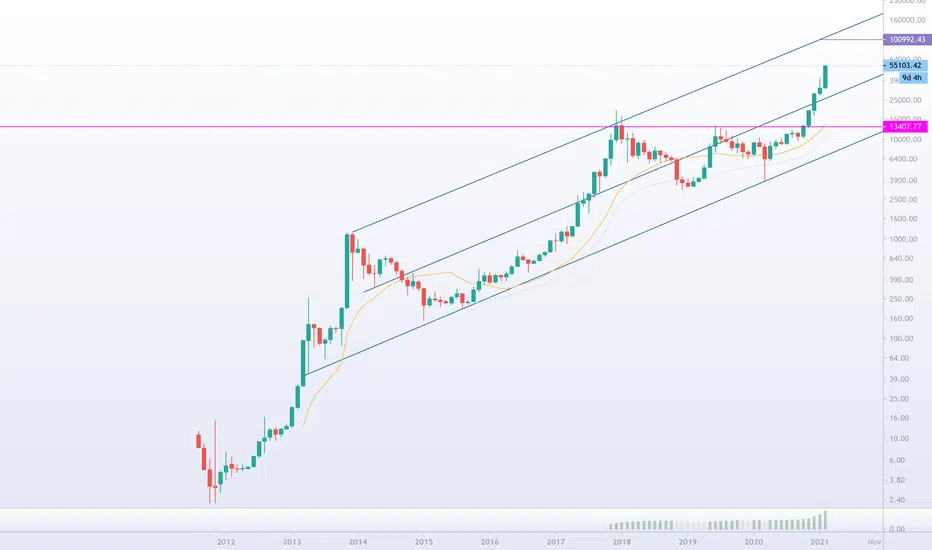
Check this logarithmic monthly view for BTCUSD.
2013
Peak: 1100$
Correction middle of this channel: 300-400$
Bottom: 150-200$
2017
Peak: 19.200$
Correction middle of this channel: 6200$ (monthly EMA 50, 200, and bollinger too there)
Bottom: 3800$
2021 (2022?)
Peak: 100.000$ ?
Correction middle of this channel: 44.000$ ?
Bottom of the channel approx...: 30.000$ ?
Correction cycles around 600-800 days...
Giants like TSLA, JP, Goldman, etc... will make the 20.000$ breakout (2020) as the new 1200$ breakout? (2017) We will never see again that lows???
2013
Peak: 1100$
Correction middle of this channel: 300-400$
Bottom: 150-200$
2017
Peak: 19.200$
Correction middle of this channel: 6200$ (monthly EMA 50, 200, and bollinger too there)
Bottom: 3800$
2021 (2022?)
Peak: 100.000$ ?
Correction middle of this channel: 44.000$ ?
Bottom of the channel approx...: 30.000$ ?
Correction cycles around 600-800 days...
Giants like TSLA, JP, Goldman, etc... will make the 20.000$ breakout (2020) as the new 1200$ breakout? (2017) We will never see again that lows???

Haftungsausschluss
Die Informationen und Veröffentlichungen sind nicht als Finanz-, Anlage-, Handels- oder andere Arten von Ratschlägen oder Empfehlungen gedacht, die von TradingView bereitgestellt oder gebilligt werden, und stellen diese nicht dar. Lesen Sie mehr in den Nutzungsbedingungen.
Haftungsausschluss
Die Informationen und Veröffentlichungen sind nicht als Finanz-, Anlage-, Handels- oder andere Arten von Ratschlägen oder Empfehlungen gedacht, die von TradingView bereitgestellt oder gebilligt werden, und stellen diese nicht dar. Lesen Sie mehr in den Nutzungsbedingungen.