
Look at the monthly timeframe
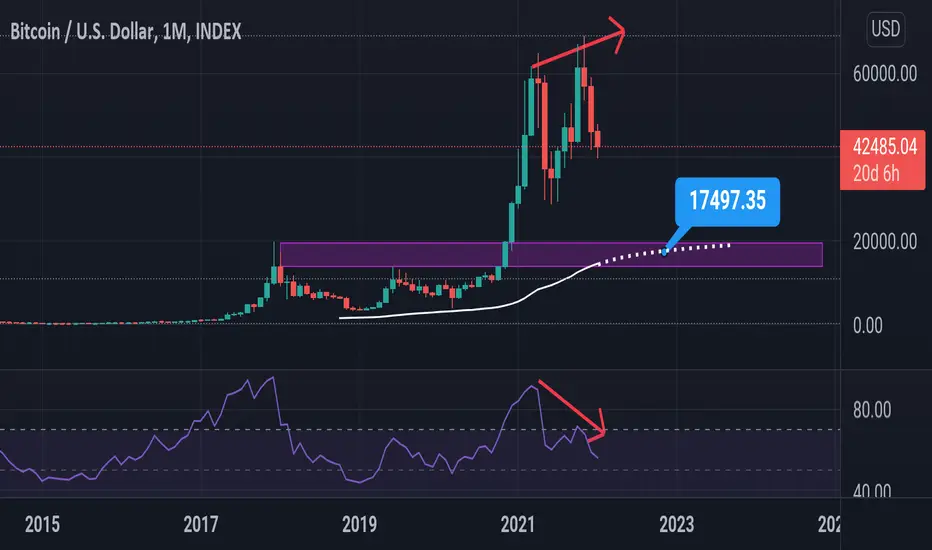
What do you see? Higher timeframes never lie and they're very simple to understand! We see a double top around 60_70K which is a very strong resistance also we see a bearish divergence because as price making higher highs RSI making lower highs also RSI is overbought. There's a support around 18_13K and also 100 monthly EMA is exactly there to support the price in future. These are very simple and obvious. Now you look at the chart and tell me what do you expect from bitcoin?
What do you see? Higher timeframes never lie and they're very simple to understand! We see a double top around 60_70K which is a very strong resistance also we see a bearish divergence because as price making higher highs RSI making lower highs also RSI is overbought. There's a support around 18_13K and also 100 monthly EMA is exactly there to support the price in future. These are very simple and obvious. Now you look at the chart and tell me what do you expect from bitcoin?
Anmerkung
As you see guys higher timeframes never lie. When we're bearish in higher timeframes it means indeed we're bearish in longterm.17K is in sight.

Verbundene Veröffentlichungen
Haftungsausschluss
Die Informationen und Veröffentlichungen sind nicht als Finanz-, Anlage-, Handels- oder andere Arten von Ratschlägen oder Empfehlungen gedacht, die von TradingView bereitgestellt oder gebilligt werden, und stellen diese nicht dar. Lesen Sie mehr in den Nutzungsbedingungen.