
Please support this idea with a LIKE👍 if you find it useful🥳
Not a financial advice🙅🏼♂️
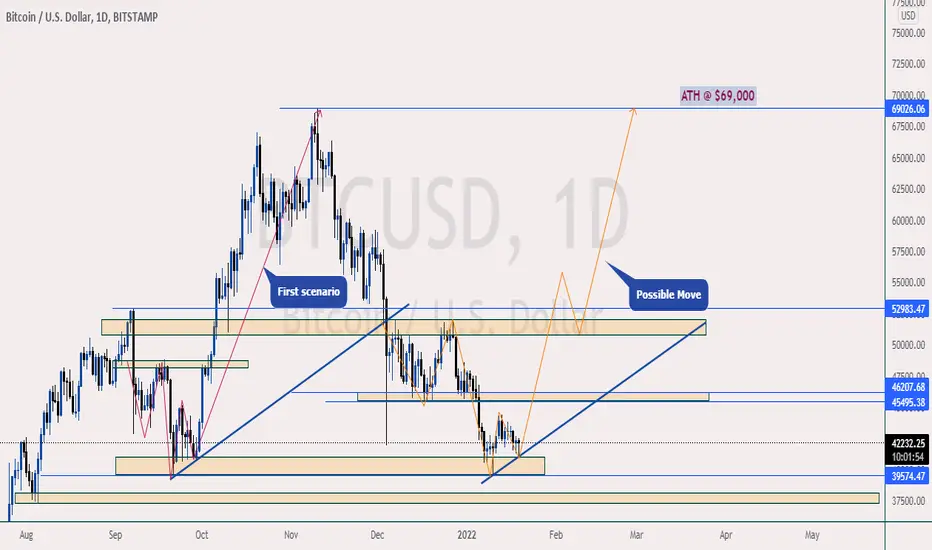
From the first scenario, we can see price fall from the supply zone down to the $40,000 demand region.
Then it started to rise again with a double bottom pattern on a new trend which took it to ATH at $69,000.
Now we have a similar scenario on the current chart. Will history repeat itself?
What do you think?
Share your opinion in the comment section✍️
Follow me to receive more updates on BTCUSD ( BITCOIN ) 🤗
Happy Trading💰🥳🤗
Not a financial advice🙅🏼♂️
From the first scenario, we can see price fall from the supply zone down to the $40,000 demand region.
Then it started to rise again with a double bottom pattern on a new trend which took it to ATH at $69,000.
Now we have a similar scenario on the current chart. Will history repeat itself?
What do you think?
Share your opinion in the comment section✍️
Follow me to receive more updates on BTCUSD ( BITCOIN ) 🤗
Happy Trading💰🥳🤗
Trade ist aktiv
YES👆 OR NO👇 ??
Verbundene Veröffentlichungen
Haftungsausschluss
Die Informationen und Veröffentlichungen sind nicht als Finanz-, Anlage-, Handels- oder andere Arten von Ratschlägen oder Empfehlungen gedacht, die von TradingView bereitgestellt oder gebilligt werden, und stellen diese nicht dar. Lesen Sie mehr in den Nutzungsbedingungen.
Verbundene Veröffentlichungen
Haftungsausschluss
Die Informationen und Veröffentlichungen sind nicht als Finanz-, Anlage-, Handels- oder andere Arten von Ratschlägen oder Empfehlungen gedacht, die von TradingView bereitgestellt oder gebilligt werden, und stellen diese nicht dar. Lesen Sie mehr in den Nutzungsbedingungen.