
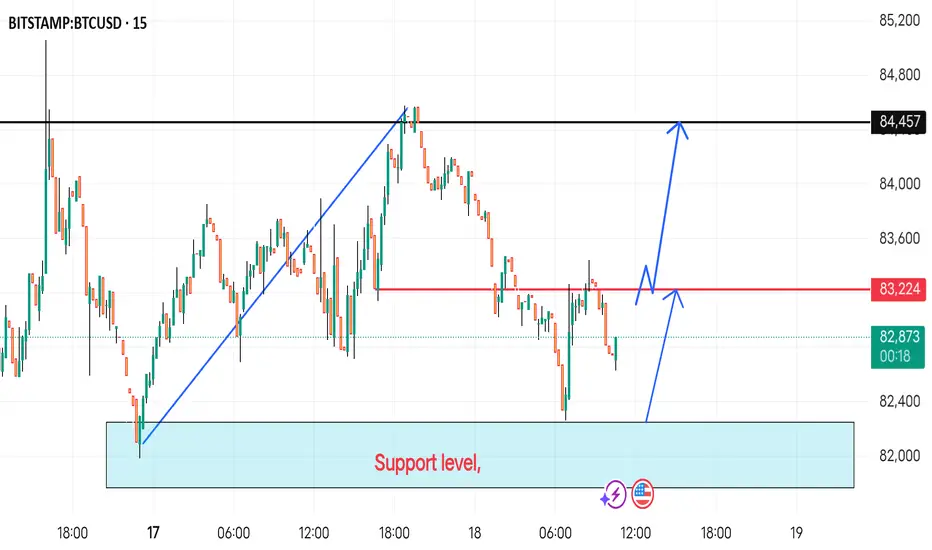
This BTC/USD chart shows a possible bullish setup based on support and resistance levels:
Support Zone (~82,000): The blue highlighted area represents a key support level where buyers might step in.
Resistance Levels:
83,224 (Red Line): A potential resistance level where price might react.
84,457 (Black Line): A stronger resistance level and the ultimate upside target.
Expected Scenarios (Blue Arrows):
1. Bounce from Support → Break 83,224 → Rally to 84,457.
2. Rejection at 83,224 → Retest Support → Second attempt at a breakout.
This suggests that if BTC holds above support, a bullish move is likely. If it fails, a retest of the support zone could happen.
Support Zone (~82,000): The blue highlighted area represents a key support level where buyers might step in.
Resistance Levels:
83,224 (Red Line): A potential resistance level where price might react.
84,457 (Black Line): A stronger resistance level and the ultimate upside target.
Expected Scenarios (Blue Arrows):
1. Bounce from Support → Break 83,224 → Rally to 84,457.
2. Rejection at 83,224 → Retest Support → Second attempt at a breakout.
This suggests that if BTC holds above support, a bullish move is likely. If it fails, a retest of the support zone could happen.

Haftungsausschluss
Die Informationen und Veröffentlichungen sind nicht als Finanz-, Anlage-, Handels- oder andere Arten von Ratschlägen oder Empfehlungen gedacht, die von TradingView bereitgestellt oder gebilligt werden, und stellen diese nicht dar. Lesen Sie mehr in den Nutzungsbedingungen.
Haftungsausschluss
Die Informationen und Veröffentlichungen sind nicht als Finanz-, Anlage-, Handels- oder andere Arten von Ratschlägen oder Empfehlungen gedacht, die von TradingView bereitgestellt oder gebilligt werden, und stellen diese nicht dar. Lesen Sie mehr in den Nutzungsbedingungen.