
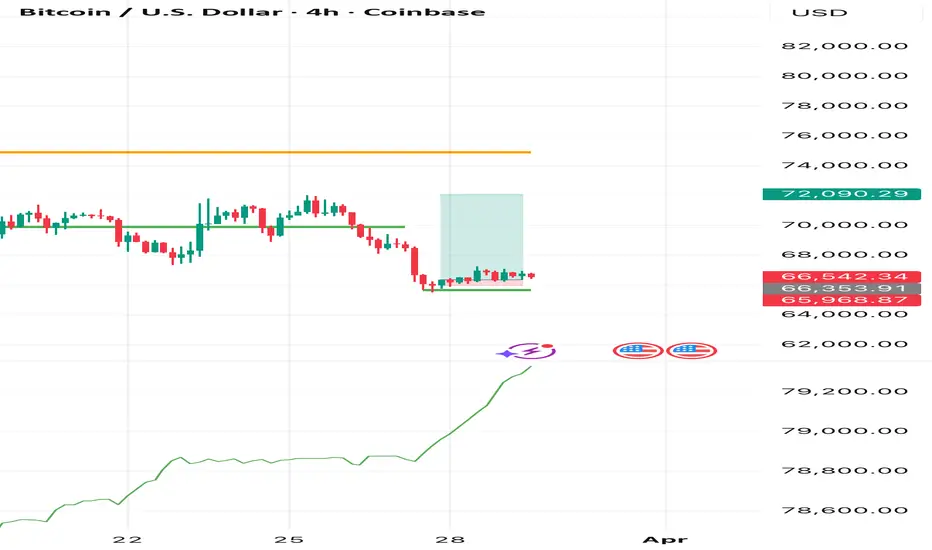
BTC TA suggests bullish trend for w/c 30th March 2026.
Bitcoin has defended the $66,500 – $68,500 support cluster multiple times in recent sessions, printing clear higher lows on the daily and 4H timeframes. This creates a bullish structure while price consolidates just below the overhead resistance.
• Strong absorption visible on dips with volume showing buyer interest around the 0.382 Fib retracement ($66,600 – $67,800) and the ascending trendline from February lows.
• RSI (14) holding neutral territory (42–50) across daily/weekly with early signs of positive divergence on lower timeframes — price made lower lows while RSI failed to follow.
• MACD histogram flattening and beginning to curl upward on shorter intervals, setting up for a potential bullish cross if momentum continues to build.
• Short-term moving averages (5/10) acting as dynamic support near current levels. A decisive reclaim of $70,000 – $71,000 would flip recent supply into demand.
• Pattern-wise, the chart is forming higher lows inside a broader corrective channel. A clean daily close above $71,336 confirms short-term bullish continuation and opens measured moves toward $75,000 – $76,000, with extension targets at $80K+.
From fundamentals perspective, this aligns with gold turning bullish indicating pivot back to hedging and commodity holding as stocks continue to deliver negative returns
Bitcoin has defended the $66,500 – $68,500 support cluster multiple times in recent sessions, printing clear higher lows on the daily and 4H timeframes. This creates a bullish structure while price consolidates just below the overhead resistance.
• Strong absorption visible on dips with volume showing buyer interest around the 0.382 Fib retracement ($66,600 – $67,800) and the ascending trendline from February lows.
• RSI (14) holding neutral territory (42–50) across daily/weekly with early signs of positive divergence on lower timeframes — price made lower lows while RSI failed to follow.
• MACD histogram flattening and beginning to curl upward on shorter intervals, setting up for a potential bullish cross if momentum continues to build.
• Short-term moving averages (5/10) acting as dynamic support near current levels. A decisive reclaim of $70,000 – $71,000 would flip recent supply into demand.
• Pattern-wise, the chart is forming higher lows inside a broader corrective channel. A clean daily close above $71,336 confirms short-term bullish continuation and opens measured moves toward $75,000 – $76,000, with extension targets at $80K+.
From fundamentals perspective, this aligns with gold turning bullish indicating pivot back to hedging and commodity holding as stocks continue to deliver negative returns

Haftungsausschluss
Die Informationen und Veröffentlichungen sind nicht als Finanz-, Anlage-, Handels- oder andere Arten von Ratschlägen oder Empfehlungen gedacht, die von TradingView bereitgestellt oder gebilligt werden, und stellen diese nicht dar. Lesen Sie mehr in den Nutzungsbedingungen.
Haftungsausschluss
Die Informationen und Veröffentlichungen sind nicht als Finanz-, Anlage-, Handels- oder andere Arten von Ratschlägen oder Empfehlungen gedacht, die von TradingView bereitgestellt oder gebilligt werden, und stellen diese nicht dar. Lesen Sie mehr in den Nutzungsbedingungen.