
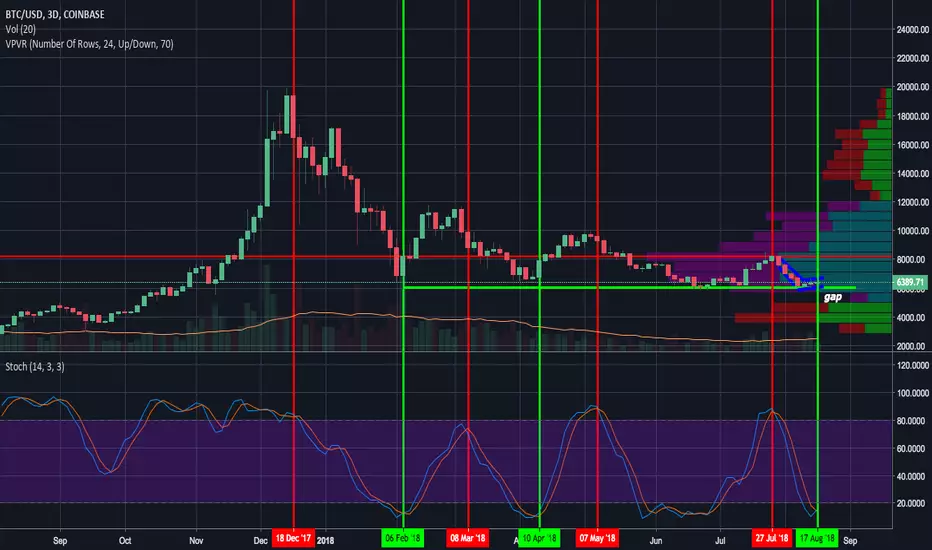
I believe that it is possible to beat the market through a consistent and unemotional approach. This is primarily achieved through preparing instead of reacting. Click here to get my complete trading strategy and click here to learn more about how I use the indicators below! Please be advised that I swing trade and will often hold onto a position for > 1 month. What you do with your $ is your business, what I do with my $ is my business.
1 day: $6,000 retest | 1 week: $5,750 breakdown | 1 month predictions: < $5,000 BTC by 9/5 | bottom prediction: $3,000 by 10/30
Previous analysis/position: / Short ADA:BTC | ETH:USD | ETH:BTC
Patterns: bear flag and descending triangle
Horizontal support and resistance: S: $6,350 & R: $6,450
BTCUSDSHORTS: Still supporting > 31,000 | price flip on the TD'
Funding Rates: shorts pay longs 0.067%
12 & 26 EMA’s (calculate % difference): 12: - 1.43% | 26: -5.04%
50 & 128 MA’s: 50: -7.68% | 128: -14.66%
Volume: Has decreased significantly over last two days while price pulled back.
FIB’s: 0.236: $6,579 | 0.00: $5,982 (start with top of 6/18 and connect to low on 8/10
Candlestick analysis: Weekly hammer/spinning top. Wick on top seems slightly too long for a hammer. Dark cloud cover from yesterday is very bearish.
Ichimoku Cloud: Tenkan-sen and Kijun-sen are starting to diverge. Thick cloud at $6,800 - $7,000 provides confirmation that should the highest this bounce is expected to go.
TD’ Sequential: G3 < G2 | Weekly R2 > R1
Visible Range: Low volume node on 1d lookback at $6,450 has been filled. Expect point of control at $6,358 to be retested. Stacked on top from $6,800- $8,500
BTC’ Price Spreadsheet: 12h = +0.70% | 24h = +/- 0 | 1w = +2.40% | 2w = -9.21% | 1m = `12.51% (big move from 7/18 just got added which could cause MA’s to angle downward today)
Bollinger Bands: MA at $6,692 should serve as strong resistance. Weekly is starting to squeeze and indicates that we could be ready for months of sideways movement until getting a super squeeze like we did in 2017
Trendline: Bear flag creates trendlines
Daily Trend: Bearish
Fractals: Up: $6,618 | Down: $5,916
On Balance Volume: Following price/no noticeable divergences
ADX: Weekly ADX is creating higher highs and higher lows after +DI failed to cross above -DI. Daily -DI and +DI are converging while ADX is starting to pullback.
Chaikin Money Flow: Weekly has a bull div’ with CMF' breaking through 0.04 resistance and supporting a throwback. Daily was consolidating into pennant with higher low and lower high. Just made a new low
RSI (30 setting): Weekly at 48.57 after pulling back from > 50. Daily attempting to turn 43.7 into support after it served as resistance. Will it go for a 50 retest?
Stoch: Weekly recently crossed and is still heading downward. 3D getting a buy signal today (has been strong signal during bear market) Will %K be able to break 40 on the daily?
Summary: Funding rates, BTCUSDSHORTS, buy signal on the 3D stochastic are all giving me reason to be concerned.
Resistance from the visible range volume profile, daily Ichimoku Cloud and recent up fractal are telling me to stick with the plan. A short squeeze from $6,380 up to the $6,8000 - $7,000 range would be ideal for short sellers.
It would provide a very attractive entry based on risk:reward and it would provide the equilibrium in the short:long ratio that we would need in order to break down major support from $5,750 - $6,300.
Normally I would move my stop slightly above most recent up fractal at $6,618 in combination with the long wick from 8/15. However, due to the short sellers and built up resistance fro $6,800 - $7,000 I would still keep it slightly above that area. Keep in mind I am not short BTC, I am short alts, this is just how I would play it.
If you are not in a position then wait to see if you can sell $6,800 - $7,000. If we break down $6,250 before that happens then it would confirm the bear flag also provide an entry.
If you found this helpful then like, comment, subscribe and share!
1 day: $6,000 retest | 1 week: $5,750 breakdown | 1 month predictions: < $5,000 BTC by 9/5 | bottom prediction: $3,000 by 10/30
Previous analysis/position: / Short ADA:BTC | ETH:USD | ETH:BTC
Patterns: bear flag and descending triangle
Horizontal support and resistance: S: $6,350 & R: $6,450
BTCUSDSHORTS: Still supporting > 31,000 | price flip on the TD'
Funding Rates: shorts pay longs 0.067%
12 & 26 EMA’s (calculate % difference): 12: - 1.43% | 26: -5.04%
50 & 128 MA’s: 50: -7.68% | 128: -14.66%
Volume: Has decreased significantly over last two days while price pulled back.
FIB’s: 0.236: $6,579 | 0.00: $5,982 (start with top of 6/18 and connect to low on 8/10
Candlestick analysis: Weekly hammer/spinning top. Wick on top seems slightly too long for a hammer. Dark cloud cover from yesterday is very bearish.
Ichimoku Cloud: Tenkan-sen and Kijun-sen are starting to diverge. Thick cloud at $6,800 - $7,000 provides confirmation that should the highest this bounce is expected to go.
TD’ Sequential: G3 < G2 | Weekly R2 > R1
Visible Range: Low volume node on 1d lookback at $6,450 has been filled. Expect point of control at $6,358 to be retested. Stacked on top from $6,800- $8,500
BTC’ Price Spreadsheet: 12h = +0.70% | 24h = +/- 0 | 1w = +2.40% | 2w = -9.21% | 1m = `12.51% (big move from 7/18 just got added which could cause MA’s to angle downward today)
Bollinger Bands: MA at $6,692 should serve as strong resistance. Weekly is starting to squeeze and indicates that we could be ready for months of sideways movement until getting a super squeeze like we did in 2017
Trendline: Bear flag creates trendlines
Daily Trend: Bearish
Fractals: Up: $6,618 | Down: $5,916
On Balance Volume: Following price/no noticeable divergences
ADX: Weekly ADX is creating higher highs and higher lows after +DI failed to cross above -DI. Daily -DI and +DI are converging while ADX is starting to pullback.
Chaikin Money Flow: Weekly has a bull div’ with CMF' breaking through 0.04 resistance and supporting a throwback. Daily was consolidating into pennant with higher low and lower high. Just made a new low
RSI (30 setting): Weekly at 48.57 after pulling back from > 50. Daily attempting to turn 43.7 into support after it served as resistance. Will it go for a 50 retest?
Stoch: Weekly recently crossed and is still heading downward. 3D getting a buy signal today (has been strong signal during bear market) Will %K be able to break 40 on the daily?
Summary: Funding rates, BTCUSDSHORTS, buy signal on the 3D stochastic are all giving me reason to be concerned.
Resistance from the visible range volume profile, daily Ichimoku Cloud and recent up fractal are telling me to stick with the plan. A short squeeze from $6,380 up to the $6,8000 - $7,000 range would be ideal for short sellers.
It would provide a very attractive entry based on risk:reward and it would provide the equilibrium in the short:long ratio that we would need in order to break down major support from $5,750 - $6,300.
Normally I would move my stop slightly above most recent up fractal at $6,618 in combination with the long wick from 8/15. However, due to the short sellers and built up resistance fro $6,800 - $7,000 I would still keep it slightly above that area. Keep in mind I am not short BTC, I am short alts, this is just how I would play it.
If you are not in a position then wait to see if you can sell $6,800 - $7,000. If we break down $6,250 before that happens then it would confirm the bear flag also provide an entry.
If you found this helpful then like, comment, subscribe and share!

emasar Indicator is available for purchase at alphanalysis.io/product/emasar/
Haftungsausschluss
Die Informationen und Veröffentlichungen sind nicht als Finanz-, Anlage-, Handels- oder andere Arten von Ratschlägen oder Empfehlungen gedacht, die von TradingView bereitgestellt oder gebilligt werden, und stellen diese nicht dar. Lesen Sie mehr in den Nutzungsbedingungen.
emasar Indicator is available for purchase at alphanalysis.io/product/emasar/
Haftungsausschluss
Die Informationen und Veröffentlichungen sind nicht als Finanz-, Anlage-, Handels- oder andere Arten von Ratschlägen oder Empfehlungen gedacht, die von TradingView bereitgestellt oder gebilligt werden, und stellen diese nicht dar. Lesen Sie mehr in den Nutzungsbedingungen.