Bitcoin ( BTC) Daily: Severe Volume Drying Highlights Imminent Volatility Expansion Inside Tight Apex Node
### ₿ Bitcoin / U.S. Dollar ( BTCUSD) Daily Technical Matrix (Ref: BTCUSD_2026-08-07_09-08-56.png)
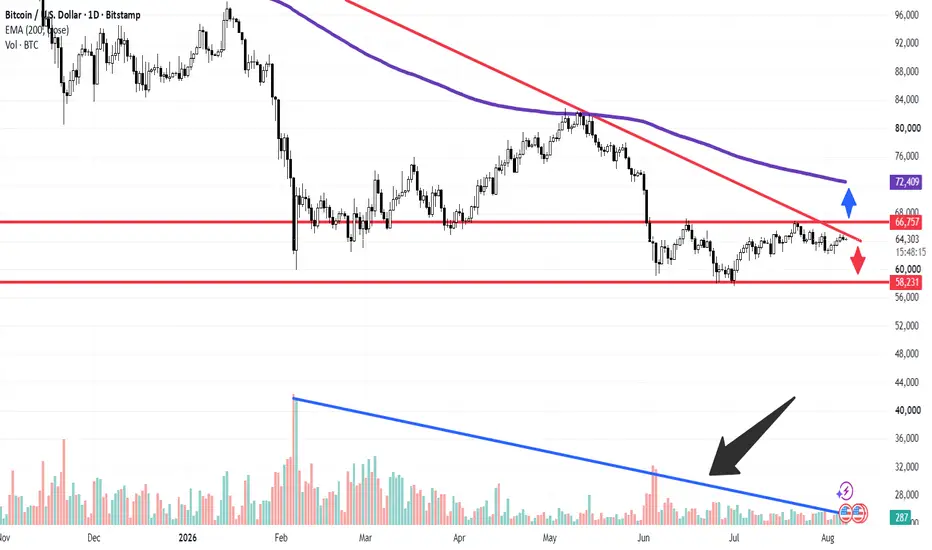
We are releasing an updated Daily (1D) structural framework on Bitcoin (BTCUSD / BTC). Price action has compressed into a narrow wedge apex directly below horizontal static supply, accompanied by a textbook drying up of trading volume across major spot exchanges.
Bitcoin is currently trading essentially flat at **64,278 (+0.03%)**, trapped within a high-compression decision zone.
---
### 🔍 Technical Architecture & Volume Divergence Analysis:
Our quantitative setup isolates the key structural mechanics shaping the market:
1. **Volume Contraction (Black Arrow & Blue Baseline):** As emphasized by the descending blue trendline on the volume panel, trading volume has steadily decreased to minimal participation levels (**287 BTC** on current daily readings). This extreme drop in liquidity during price consolidation typically signals a "calm before the storm," where low volume precedes a massive directional volatility expansion.
2. **Descending Resistance Structure (Red LTB Line):** Lower highs continue to compress price action against the primary descending trendline (red LTB) and the major horizontal resistance ceiling at **66,757**.
3. **Primary Structural Support Floor:** Sell-side risk is buffered by the established horizontal support baseline at **58,231**, where buyers previously absorbed supply.
---
### 🛡️ Strategic Directional Scenarios (Blue vs. Red Arrow Projections):
* **Scenario A — Bullish Volume Expansion Breakout (Blue Arrow):** A high-volume daily close breaking above the red LTB and reclaiming the **66,757** resistance ceiling will confirm an upside breakout, opening the path for a mean-reversion rally toward the institutional **200-period EMA (purple line at 72,409)**.
* **Scenario B — Bearish Breakdown Extension (Red Arrow):** A failure to break overhead supply, combined with persistent buy-side volume exhaustion, will lead to a rejection off the LTB, risking a retest and eventual breakdown below the **58,231** support floor.
### 📊 Tactical Parameters Summary:
* **Current Bias:** High-Compression Neutral / Imminent Volatility Breakout
* **Key Overhead Resistance Ceiling:** 66,757
* **Major Upside Reclaim Target (200-EMA):** 72,409
* **Primary Downside Support Base:** 58,231
* **Structural Catalyst:** Volume Drying / Apex Squeeze
---
📊 **ChartPro Data**
*Digital Asset Architecture, Volume Microstructure & Systematic Risk Management.*
⚠️ **Disclaimer:** For educational and informational purposes only. This active market study represents a personal trading framework and does not constitute financial or investment advice.
BTC) Daily: Severe Volume Drying Highlights Imminent Volatility Expansion Inside Tight Apex Node### ₿ Bitcoin / U.S. Dollar (
BTCUSD) Daily Technical Matrix (Ref: BTCUSD_2026-08-07_09-08-56.png)We are releasing an updated Daily (1D) structural framework on Bitcoin (
BTCUSD / BTC). Price action has compressed into a narrow wedge apex directly below horizontal static supply, accompanied by a textbook drying up of trading volume across major spot exchanges.Bitcoin is currently trading essentially flat at **64,278 (+0.03%)**, trapped within a high-compression decision zone.
---
### 🔍 Technical Architecture & Volume Divergence Analysis:
Our quantitative setup isolates the key structural mechanics shaping the market:
1. **Volume Contraction (Black Arrow & Blue Baseline):** As emphasized by the descending blue trendline on the volume panel, trading volume has steadily decreased to minimal participation levels (**287 BTC** on current daily readings). This extreme drop in liquidity during price consolidation typically signals a "calm before the storm," where low volume precedes a massive directional volatility expansion.
2. **Descending Resistance Structure (Red LTB Line):** Lower highs continue to compress price action against the primary descending trendline (red LTB) and the major horizontal resistance ceiling at **66,757**.
3. **Primary Structural Support Floor:** Sell-side risk is buffered by the established horizontal support baseline at **58,231**, where buyers previously absorbed supply.
---
### 🛡️ Strategic Directional Scenarios (Blue vs. Red Arrow Projections):
* **Scenario A — Bullish Volume Expansion Breakout (Blue Arrow):** A high-volume daily close breaking above the red LTB and reclaiming the **66,757** resistance ceiling will confirm an upside breakout, opening the path for a mean-reversion rally toward the institutional **200-period EMA (purple line at 72,409)**.
* **Scenario B — Bearish Breakdown Extension (Red Arrow):** A failure to break overhead supply, combined with persistent buy-side volume exhaustion, will lead to a rejection off the LTB, risking a retest and eventual breakdown below the **58,231** support floor.
### 📊 Tactical Parameters Summary:
* **Current Bias:** High-Compression Neutral / Imminent Volatility Breakout
* **Key Overhead Resistance Ceiling:** 66,757
* **Major Upside Reclaim Target (200-EMA):** 72,409
* **Primary Downside Support Base:** 58,231
* **Structural Catalyst:** Volume Drying / Apex Squeeze
---
📊 **ChartPro Data**
*Digital Asset Architecture, Volume Microstructure & Systematic Risk Management.*
⚠️ **Disclaimer:** For educational and informational purposes only. This active market study represents a personal trading framework and does not constitute financial or investment advice.

Haftungsausschluss
Die Informationen und Veröffentlichungen sind nicht als Finanz-, Anlage-, Handels- oder andere Arten von Ratschlägen oder Empfehlungen gedacht, die von TradingView bereitgestellt oder gebilligt werden, und stellen diese nicht dar. Lesen Sie mehr in den Nutzungsbedingungen.
Haftungsausschluss
Die Informationen und Veröffentlichungen sind nicht als Finanz-, Anlage-, Handels- oder andere Arten von Ratschlägen oder Empfehlungen gedacht, die von TradingView bereitgestellt oder gebilligt werden, und stellen diese nicht dar. Lesen Sie mehr in den Nutzungsbedingungen.