
BTC vs Russell 2000 — Risk Cycles in Context
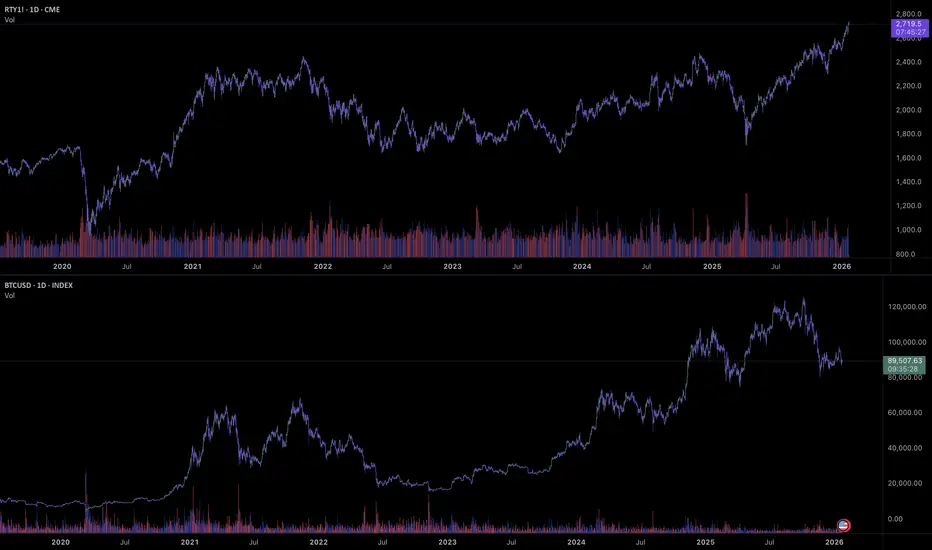
This chart compares Bitcoin (BTC) with the Russell 2000 Index (RTY) on a higher timeframe to observe how risk assets have behaved across market cycles.
From December 2020 to December 2021, both BTC and the Russell 2000 experienced strong upside expansion. That period was characterized by:
Broad risk-on conditions
Expanding liquidity
Strong participation across equities and crypto
BTC rallied sharply during this window, while the Russell 2000 also trended higher, reflecting aligned risk appetite across asset classes.
Following that cycle peak, both markets entered extended consolidation and drawdown phases, though with different volatility profiles. BTC exhibited larger percentage swings, while RTY moved more gradually through distribution and recovery phases.
Currently, the Russell 2000 is breaking out to new highs, suggesting renewed strength in small-cap equities. Historically, sustained breakouts in RTY have coincided with improving risk conditions across broader markets.
BTC, by contrast, remains below its recent highs and is still working through its own consolidation structure. The divergence between RTY strength and BTC range behavior is notable and worth monitoring.
Key takeaway:
This comparison highlights how shifts in traditional risk assets can provide useful macro context for crypto. Whether BTC begins to follow renewed equity strength or continues to diverge remains an important development to track going forward.
Not financial advice. For market structure and comparative analysis only.
This chart compares Bitcoin (BTC) with the Russell 2000 Index (RTY) on a higher timeframe to observe how risk assets have behaved across market cycles.
From December 2020 to December 2021, both BTC and the Russell 2000 experienced strong upside expansion. That period was characterized by:
Broad risk-on conditions
Expanding liquidity
Strong participation across equities and crypto
BTC rallied sharply during this window, while the Russell 2000 also trended higher, reflecting aligned risk appetite across asset classes.
Following that cycle peak, both markets entered extended consolidation and drawdown phases, though with different volatility profiles. BTC exhibited larger percentage swings, while RTY moved more gradually through distribution and recovery phases.
Currently, the Russell 2000 is breaking out to new highs, suggesting renewed strength in small-cap equities. Historically, sustained breakouts in RTY have coincided with improving risk conditions across broader markets.
BTC, by contrast, remains below its recent highs and is still working through its own consolidation structure. The divergence between RTY strength and BTC range behavior is notable and worth monitoring.
Key takeaway:
This comparison highlights how shifts in traditional risk assets can provide useful macro context for crypto. Whether BTC begins to follow renewed equity strength or continues to diverge remains an important development to track going forward.
Not financial advice. For market structure and comparative analysis only.

Haftungsausschluss
Die Informationen und Veröffentlichungen sind nicht als Finanz-, Anlage-, Handels- oder andere Arten von Ratschlägen oder Empfehlungen gedacht, die von TradingView bereitgestellt oder gebilligt werden, und stellen diese nicht dar. Lesen Sie mehr in den Nutzungsbedingungen.
Haftungsausschluss
Die Informationen und Veröffentlichungen sind nicht als Finanz-, Anlage-, Handels- oder andere Arten von Ratschlägen oder Empfehlungen gedacht, die von TradingView bereitgestellt oder gebilligt werden, und stellen diese nicht dar. Lesen Sie mehr in den Nutzungsbedingungen.