
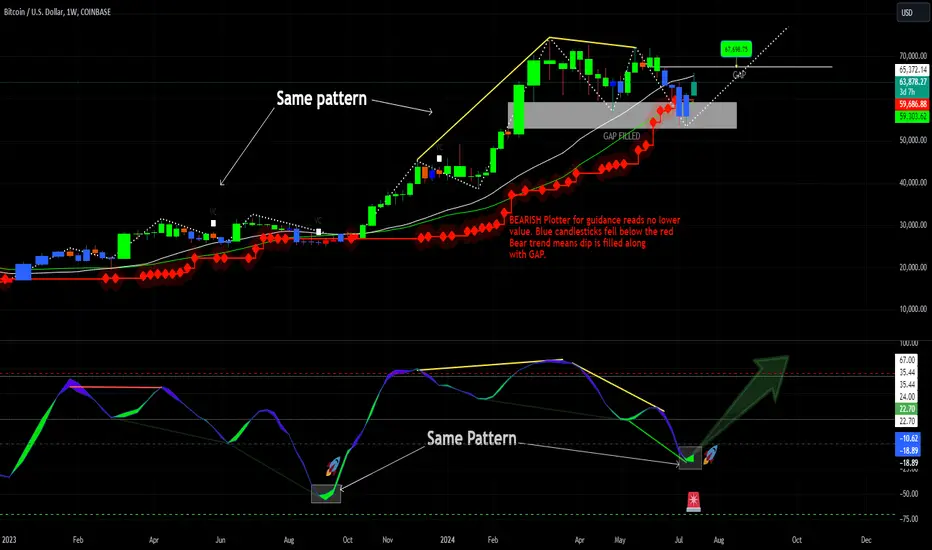
We are in an uptrend. Bearish Plooter red guidance reads dip is over as many traders still claim a huge fall. Don't understand why.
Bear red guidance plotter is part of my smart money algorithm. Blue candlesticks show below the bearish red plotter. This means the crash is done (at least for now).
SAME PATTERN: what do we expect what comes next?
Yellow trendlines show RSI guidance
Zig zags show the same old pattern being repeated
After my blue candlesticks, the BULL gets unleashed
July 17th Bull Run is pending delayed means no expected fall but our next move is to move up.
Bear red guidance plotter is part of my smart money algorithm. Blue candlesticks show below the bearish red plotter. This means the crash is done (at least for now).
SAME PATTERN: what do we expect what comes next?
Yellow trendlines show RSI guidance
Zig zags show the same old pattern being repeated
After my blue candlesticks, the BULL gets unleashed
July 17th Bull Run is pending delayed means no expected fall but our next move is to move up.
Anmerkung
This BEARISH trap threat ends by 12 noon pt.Anmerkung
As we have this bearish fake out threats. There is a sell panic. Reads to end by 5pm pt. Within this time we should then have a morning start pattern on a 4hr volume timeframe.Anmerkung
JULY 18th same pattern is being practiced. BTC has passed the smart money bullish contraction from inverse head and shoulders


"You hear the wind, but where does it go?"
Haftungsausschluss
Die Informationen und Veröffentlichungen sind nicht als Finanz-, Anlage-, Handels- oder andere Arten von Ratschlägen oder Empfehlungen gedacht, die von TradingView bereitgestellt oder gebilligt werden, und stellen diese nicht dar. Lesen Sie mehr in den Nutzungsbedingungen.
"You hear the wind, but where does it go?"
Haftungsausschluss
Die Informationen und Veröffentlichungen sind nicht als Finanz-, Anlage-, Handels- oder andere Arten von Ratschlägen oder Empfehlungen gedacht, die von TradingView bereitgestellt oder gebilligt werden, und stellen diese nicht dar. Lesen Sie mehr in den Nutzungsbedingungen.