
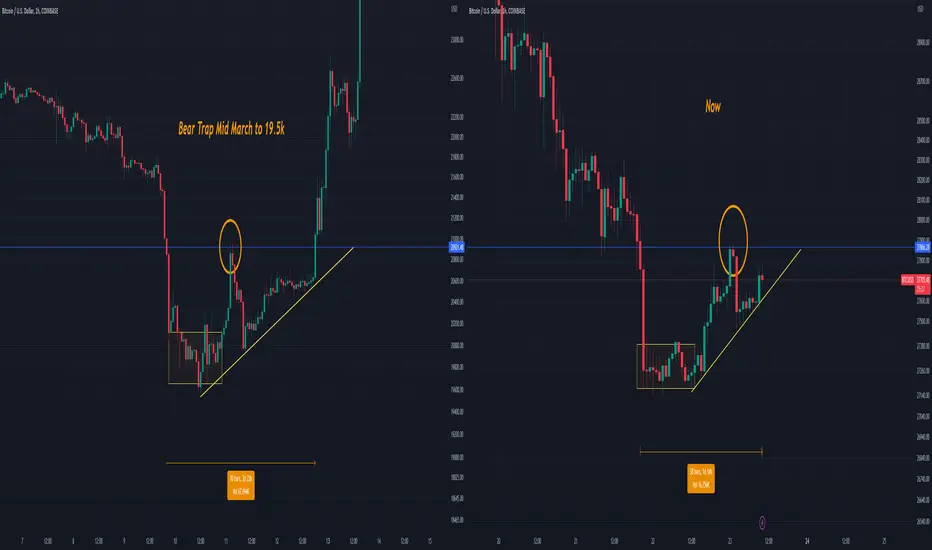
Interesting fractal appearing here on the 1hour , this is the same fractal that appeared when Bitcoin made that massive bear trap down to 19.5k.
This fractal appears in all timeframes and it is a bottoming fractal most of the time.
The higher the timeframe the bigger the move , this was the fractal that formed at 15-18k range.

Closing above the blue line within this pattern would be key here to long ,risky one no doubt.
This fractal appears in all timeframes and it is a bottoming fractal most of the time.
The higher the timeframe the bigger the move , this was the fractal that formed at 15-18k range.
Closing above the blue line within this pattern would be key here to long ,risky one no doubt.

Haftungsausschluss
Die Informationen und Veröffentlichungen sind nicht als Finanz-, Anlage-, Handels- oder andere Arten von Ratschlägen oder Empfehlungen gedacht, die von TradingView bereitgestellt oder gebilligt werden, und stellen diese nicht dar. Lesen Sie mehr in den Nutzungsbedingungen.
Haftungsausschluss
Die Informationen und Veröffentlichungen sind nicht als Finanz-, Anlage-, Handels- oder andere Arten von Ratschlägen oder Empfehlungen gedacht, die von TradingView bereitgestellt oder gebilligt werden, und stellen diese nicht dar. Lesen Sie mehr in den Nutzungsbedingungen.