
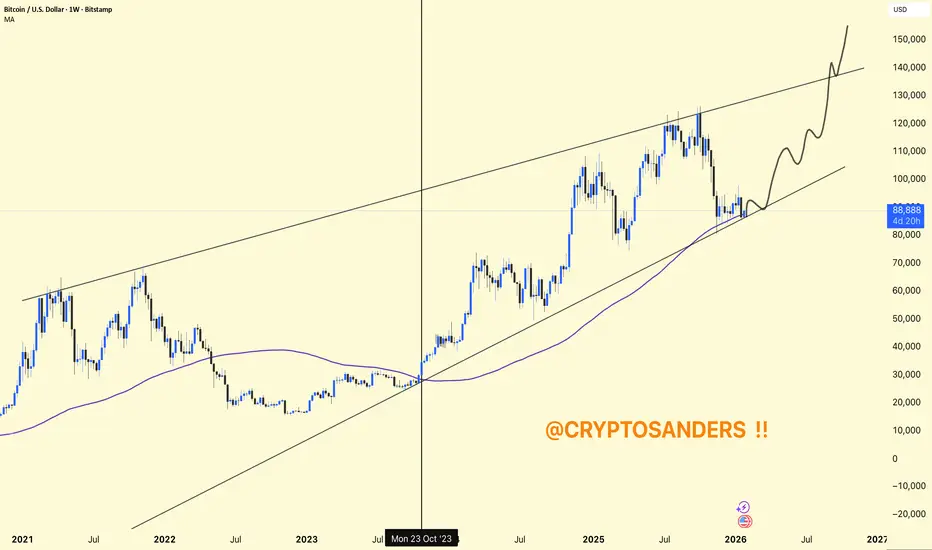
BTCUSDT (Weekly) – Long-term Chart Update.
BTC is still inside a rising channel (higher highs & higher lows intact).
Price is holding the lower trendline support of the channel — a key bullish area.
The weekly MA (~87.5k) is acting as dynamic support.
Current price: ~88.7k
This is a make-or-break support region.
As long as weekly closes stay above the lower channel + MA, the bullish structure remains valid.
Consolidation above 85k–90k.
100k psychological-
120k–125k (channel mid/upper area)
Extended cycle target 140k–150k+ (as projected)
Weekly close below ~85k.
Break of channel support → deeper correction toward 75k–70k.
short-term consolidation
Buy the dip mindset while structure holds.
BTC is still inside a rising channel (higher highs & higher lows intact).
Price is holding the lower trendline support of the channel — a key bullish area.
The weekly MA (~87.5k) is acting as dynamic support.
Current price: ~88.7k
This is a make-or-break support region.
As long as weekly closes stay above the lower channel + MA, the bullish structure remains valid.
Consolidation above 85k–90k.
100k psychological-
120k–125k (channel mid/upper area)
Extended cycle target 140k–150k+ (as projected)
Weekly close below ~85k.
Break of channel support → deeper correction toward 75k–70k.
short-term consolidation
Buy the dip mindset while structure holds.

Verbundene Veröffentlichungen
Haftungsausschluss
Die Informationen und Veröffentlichungen sind nicht als Finanz-, Anlage-, Handels- oder andere Arten von Ratschlägen oder Empfehlungen gedacht, die von TradingView bereitgestellt oder gebilligt werden, und stellen diese nicht dar. Lesen Sie mehr in den Nutzungsbedingungen.
Verbundene Veröffentlichungen
Haftungsausschluss
Die Informationen und Veröffentlichungen sind nicht als Finanz-, Anlage-, Handels- oder andere Arten von Ratschlägen oder Empfehlungen gedacht, die von TradingView bereitgestellt oder gebilligt werden, und stellen diese nicht dar. Lesen Sie mehr in den Nutzungsbedingungen.