
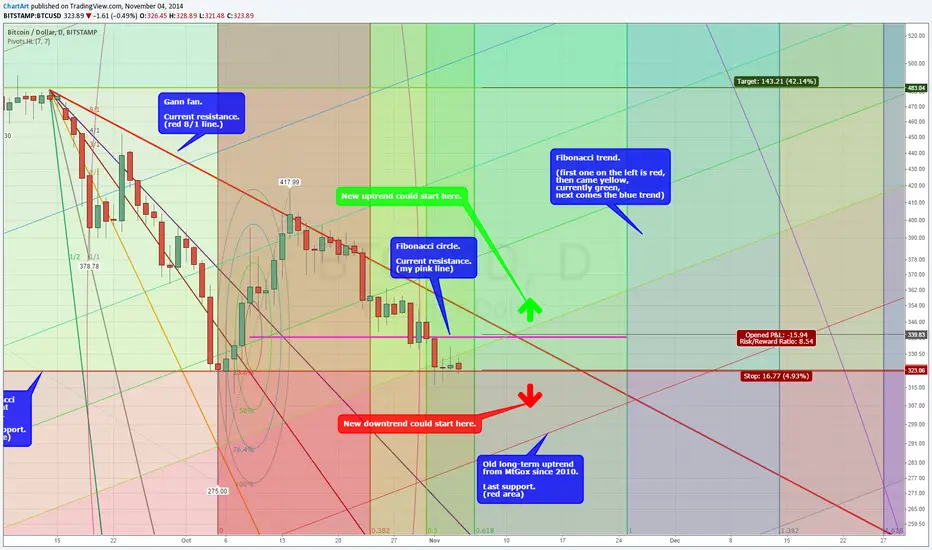
After months of decline* Bitcoin is arriving at a bottom. I see the momentum change to become bullish this week in this area above the Fibonacci retracement where Bitcoin is starting to create a double bottom pattern, if you only consider the real body of 1d candlesticks without the lower shadows (wicks). And BTC is currently at my scenario "B": tradingview.com/v/WUC4JjYo/ meaning if the price bounces here it would be a strong signal.
If not, then we are in for a new tragic slow downtrend for another couple of months in 2015.
* (tradingview.com/v/7mPxsnSP/)
P.S. If you like my charts, you can leave me a tip:
1PmAnb2htvHnCbwNAxkV7b8XvVQyQ7LQLg
Thanks!
If not, then we are in for a new tragic slow downtrend for another couple of months in 2015.
* (tradingview.com/v/7mPxsnSP/)
P.S. If you like my charts, you can leave me a tip:
1PmAnb2htvHnCbwNAxkV7b8XvVQyQ7LQLg
Thanks!

Verbundene Veröffentlichungen
Haftungsausschluss
Die Informationen und Veröffentlichungen sind nicht als Finanz-, Anlage-, Handels- oder andere Arten von Ratschlägen oder Empfehlungen gedacht, die von TradingView bereitgestellt oder gebilligt werden, und stellen diese nicht dar. Lesen Sie mehr in den Nutzungsbedingungen.
Verbundene Veröffentlichungen
Haftungsausschluss
Die Informationen und Veröffentlichungen sind nicht als Finanz-, Anlage-, Handels- oder andere Arten von Ratschlägen oder Empfehlungen gedacht, die von TradingView bereitgestellt oder gebilligt werden, und stellen diese nicht dar. Lesen Sie mehr in den Nutzungsbedingungen.