My First Bitcoin Basic Technical Analysis
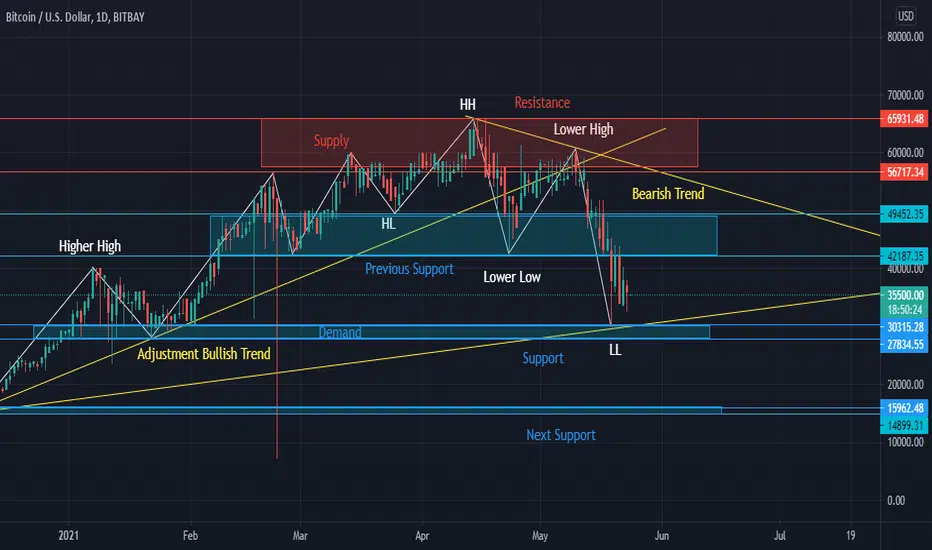
The 4 Basics:
1. Swing: in white line.
2. Trend: in yellow line.
3. Support & Resistance: Blue and Red lines.
4. Supply & Demand: in rectangles.
Summary:
The current trend is bearish after failing to break above $60000 and failing to maintain above $46000. A good buy opportunity between $28000 - $30000 especially if there is a rebound. However, a high probability of another market crash if the price drops below $28000 up to $16000 as the next support line.

Haftungsausschluss
Die Informationen und Veröffentlichungen sind nicht als Finanz-, Anlage-, Handels- oder andere Arten von Ratschlägen oder Empfehlungen gedacht, die von TradingView bereitgestellt oder gebilligt werden, und stellen diese nicht dar. Lesen Sie mehr in den Nutzungsbedingungen.
Haftungsausschluss
Die Informationen und Veröffentlichungen sind nicht als Finanz-, Anlage-, Handels- oder andere Arten von Ratschlägen oder Empfehlungen gedacht, die von TradingView bereitgestellt oder gebilligt werden, und stellen diese nicht dar. Lesen Sie mehr in den Nutzungsbedingungen.