
Most people pick a trading style by counting their free hours. That is backwards. The horizon you trade should be chosen by where the market behaves predictably, and in Bitcoin that window has been measured. A Yale study of cryptocurrency returns found this week's move significantly predicts returns one, two, three and four weeks ahead. Go shorter and the signal thins into noise. Go longer and it fades.
That band, two days to four weeks, is the swing trading window. Treat it not as a compromise for people with jobs, but as the horizon where the evidence sits.
What Is Swing Trading?
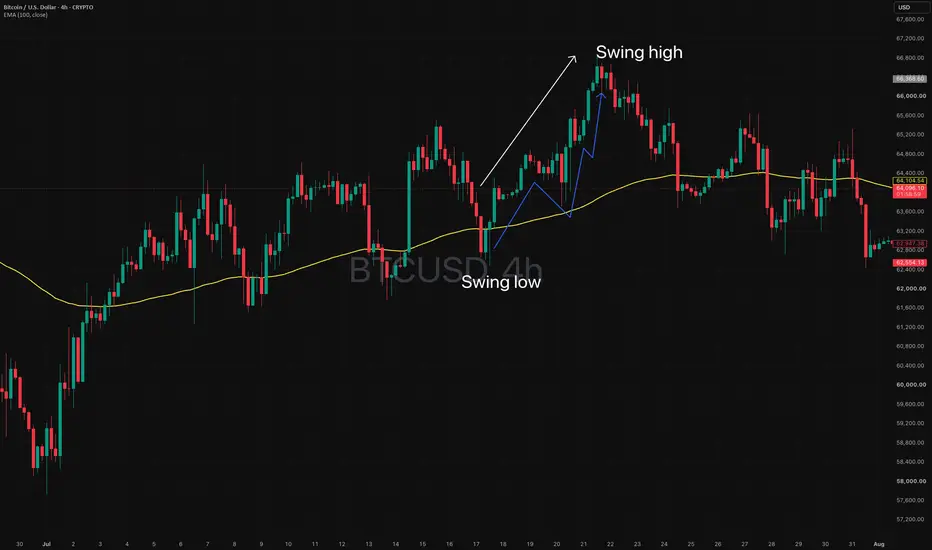
Swing trading means holding a position for several days to a few weeks to capture one directional move: a single swing from a low to a high, or the reverse. You are not chasing every wiggle. You own one leg of a trend, then step aside.
The mechanism is trend persistence. The same Yale work found a one standard deviation rise in Bitcoin's weekly return was followed by roughly 3 percent higher returns the next week. Traders who missed a move keep adding, leverage builds, attention feeds on itself. None of that resolves in an hour.
One swing on the daily chart is dozens of conflicting signals on the hourly. The swing trader owns the shaded move, not the chop inside it.
Swing trading for beginners is the more forgiving starting point, and the reason is arithmetic rather than comfort. Every trade pays a spread and a fee, so cost scales with frequency while skill does not. Across 66,465 US brokerage households, the most active traders earned 11.4 percent a year against a 17.9 percent market return. To start you need a daily chart, a written rule for where you are wrong, and small enough size to survive five losses in a row.
Swing Trading vs Day Trading
The swing trading vs day trading choice is usually framed as lifestyle. The harder question is which horizon survives costs.
Swing trading
- Holding period: two days to four weeks
- Screen time: 15 to 30 minutes at the daily close
- Trades per month: four to eight
- Cost drag: low
- Main risk: a 24/7 market that moves while you sleep
- Evidence: Bitcoin momentum is significant at 1 to 4 weeks
Day trading
- Holding period: minutes to hours, flat by day's end
- Screen time: continuous
- Trades per month: dozens to hundreds
- Cost drag: high, compounding per round trip
- Main risk: no gap exposure, but far more chances to be wrong
- Evidence: weak for retail participants
Researchers tracked everyone who began day trading Brazilian equity index futures from 2013 to 2015: among those who lasted more than 300 days, 97 percent lost money, only 1.1 percent earned above minimum wage, and experience did not improve outcomes.
Crypto sharpens the contrast. Forex and equity day trading lean on session structure: the open, the close, the London and New York overlap. Crypto has none of it, so much of the intraday playbook does not transfer. What it offers instead is width. Bitcoin’s 30-day annualized volatility historically ranges between 35% and 45%, whereas the S&P 500 typically stays in the 15% to 20% range. This makes Bitcoin roughly 2 to 3 times more volatile than the broader stock market.
Swing Trading Strategies That Work
Two setups cover most of what the daily crypto chart offers. Both are trend-based, deliberately: when seven classical rules were tested on Bitcoin daily data from 2011 to 2019, the trend and breakout rules held up and the countertrend ones failed.
The trend pullback. Price is in a clear uptrend, with the 20 EMA above the 50 EMA on the daily. It pulls back into that band, stalls, then closes back up. Enter on the reclaim candle's close, stop below the pullback low, target the prior swing high. You are buying a discount inside a trend the momentum evidence says is more likely to continue than reverse.
The reversal from a level. Price falls into a zone tested at least twice before and reacts: a rejection wick, an engulfing candle, or fading downside momentum on rising volume. Enter on the confirmation close, stop beyond the zone's far edge, target the next opposing zone. Arriving at the level is not the signal. Reacting is.
The trend pullback: entry on the reclaim candle close, stop under the pullback low, target at the prior swing high. Risk is defined before the trade, not after.
The Best Swing Trading Indicators
That same Bitcoin study is blunt about which tools earn their place. The trading range breakout rule, simply a support and resistance break, beat buy and hold on risk-adjusted returns. Moving average rules performed roughly in line with it. The two countertrend oscillators tested, RSI and Bollinger Bands, significantly underperformed and sometimes produced negative Sharpe ratios. The lesson is not that RSI is useless, but that oscillators fail as entry triggers and work as context.
- EMA 20 and 50 on the daily. A trend filter, not a signal. If the 20 is above the 50 and both are rising, take longs and ignore shorts. That alone removes most trades taken against the dominant move.
- RSI (14). A momentum gauge, not an overbought alarm. In a strong crypto uptrend the daily RSI can hold above 70 for weeks, and selling that reading is how traders end up short inside a rally. Use divergence: price making a higher high while RSI does not.
- Volume. The confirmation layer. A breakout on volume well above its recent average is a different event from the same candle on thin volume. A 2025 study of more than 3,000 coins found price-and-volume signals predicted weekly returns reliably, and survived transaction costs in liquid coins.
An overbought reading is not a sell signal. In a strong trend, daily RSI can sit above 70 for weeks while price keeps climbing.
A BTCUSDT Swing Trade, Step by Step
Swing trading crypto works best when the plan is written before the entry. Take a trend pullback on the BTCUSDT daily: price runs to 98,200, then pulls back over five sessions into the EMA near 99,200, where a prior consolidation shelf also sits.
- Confirm the trend.
- Wait for the reaction. Price must close back above the EMA, not merely touch it.
- Enter. Around 105,500, the reclaim candle's close.
- Set the stop. Below the pullback low, near 98,200, about 6 percent away.
- Set the target. The prior swing high, roughly 7 percent away, giving about 1 to 1. If resistance sat closer than the stop, skip the trade.
- Size the position. Risking 1 percent with a 5 percent stop means 20 percent of equity, unleveraged.
Then leave it alone. Watching hourly reintroduces the noise the daily chart filters out.
When Swing Trading Works and When It Fails
The case for it is the horizon itself. Bitcoin's momentum sits at one to four weeks, breakout rules beat buy and hold on its own history, and the 2025 crypto-wide study found trend signals predicted weekly returns after costs. Little in technical analysis has that much support.
The case against is regime dependence. In the same Bitcoin study, the breakout rule outperformed during 2011 to 2012, 2013 to 2014 and 2017 to 2018, all strongly trending stretches, but lagged buy and hold through the quiet 2015 to 2016 period. An edge is a property of an environment, not a constant. Those tests also excluded transaction costs, so live results would be thinner.
A range-bound BTCUSDT is therefore the swing trader's worst market. Pullbacks get chopped, breakouts fail, and the cost of being active exceeds the value of being right. The fix is not a better indicator but fewer trades: when the 20 and 50 EMAs flatten and cross repeatedly, the setup is not there. Crypto also runs 24/7, so the tape can move through your stop overnight. That argues for smaller size, not tighter stops.
Swing trading is not a slower version of day trading. It is a bet on a measured property of crypto markets: direction persists for days and weeks, not minutes. Trade inside that window, keep frequency low enough that costs stay small, and accept that in flat markets the best action is no position at all.

Haftungsausschluss
Die Informationen und Veröffentlichungen sind nicht als Finanz-, Anlage-, Handels- oder andere Arten von Ratschlägen oder Empfehlungen gedacht, die von TradingView bereitgestellt oder gebilligt werden, und stellen diese nicht dar. Lesen Sie mehr in den Nutzungsbedingungen.
Haftungsausschluss
Die Informationen und Veröffentlichungen sind nicht als Finanz-, Anlage-, Handels- oder andere Arten von Ratschlägen oder Empfehlungen gedacht, die von TradingView bereitgestellt oder gebilligt werden, und stellen diese nicht dar. Lesen Sie mehr in den Nutzungsbedingungen.