
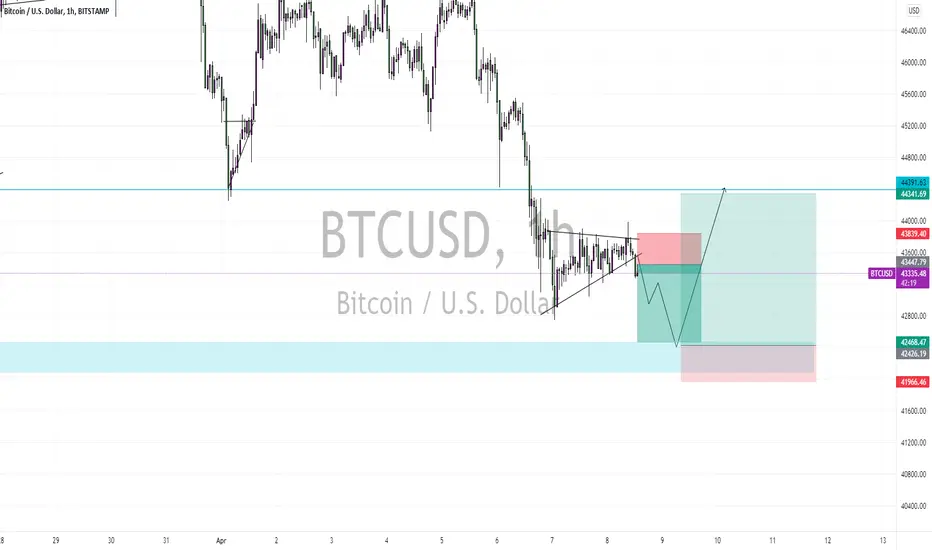
BTC Appears to have fully formed a rising wedge on the current downtrend in the 1hr timeframe, and from knowledge of chart patterns ad price action, it is obvious that a rising wedge on a downtrend is a trend continuation pattern.
This downtrend would be met with a previous zone of support at the 42,400 regions. This could lead to a bounce to the top side, following a trend to the topside before meeting resistance at a previous support level at 44,391. If this resistance fails to hold, we could witness higher highs.
This downtrend would be met with a previous zone of support at the 42,400 regions. This could lead to a bounce to the top side, following a trend to the topside before meeting resistance at a previous support level at 44,391. If this resistance fails to hold, we could witness higher highs.

Haftungsausschluss
Die Informationen und Veröffentlichungen sind nicht als Finanz-, Anlage-, Handels- oder andere Arten von Ratschlägen oder Empfehlungen gedacht, die von TradingView bereitgestellt oder gebilligt werden, und stellen diese nicht dar. Lesen Sie mehr in den Nutzungsbedingungen.
Haftungsausschluss
Die Informationen und Veröffentlichungen sind nicht als Finanz-, Anlage-, Handels- oder andere Arten von Ratschlägen oder Empfehlungen gedacht, die von TradingView bereitgestellt oder gebilligt werden, und stellen diese nicht dar. Lesen Sie mehr in den Nutzungsbedingungen.