My first TA on Bitcoin was this one: 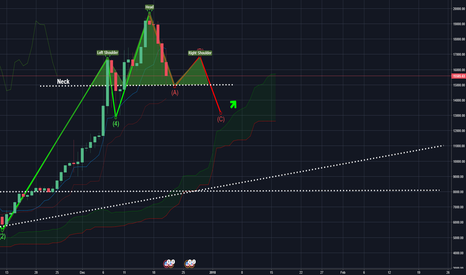 Unfortunately it was worse than what I expected, as of now
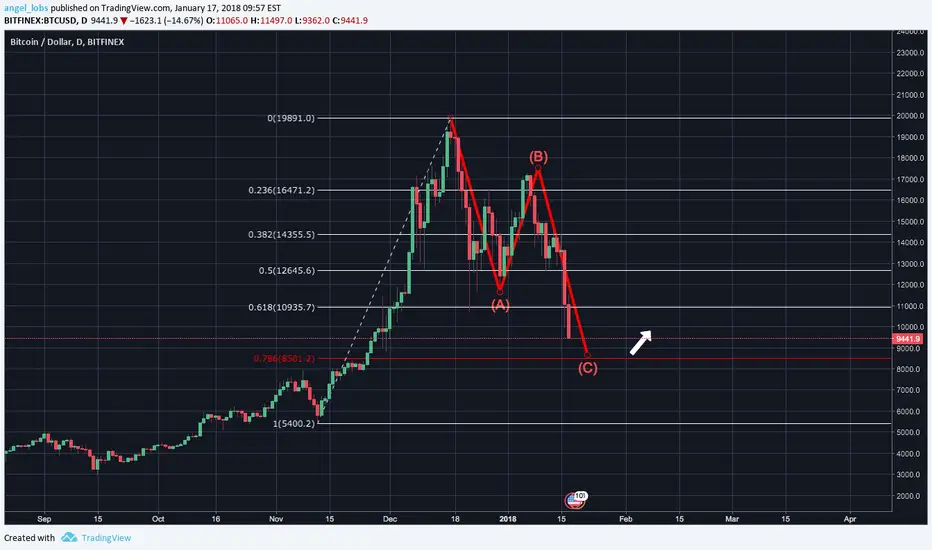
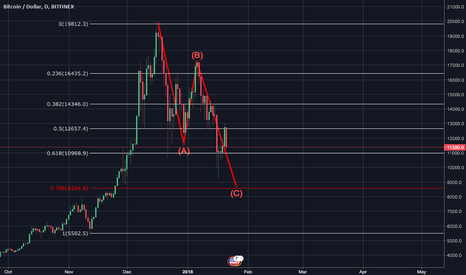
 BTCUSD is still dropping... This was expected because Bitcoin has been growing for months... It has 12345 Wave and of course it must do ABC to complete the Elliot Wave.
In this new analysis it's expected for Bitcoin to reach the 0.786 Fib level of $8501.2 IF it breaks that level and closes bellow it the 1 Fib level is at $5400.2 which I doubt, Bitcoin should finish the ABC and reverse the trend thus making all coins 'green' again.
Trade safely! (Do not take this as financial advice!)
BTCUSD is still dropping... This was expected because Bitcoin has been growing for months... It has 12345 Wave and of course it must do ABC to complete the Elliot Wave. In this new analysis it's expected for Bitcoin to reach the 0.786 Fib level of $8501.2 IF it breaks that level and closes bellow it the 1 Fib level is at $5400.2 which I doubt, Bitcoin should finish the ABC and reverse the trend thus making all coins 'green' again.
Trade safely! (Do not take this as financial advice!)
Trade ist aktiv
BTCUSD shows a lot of BULLISH signals, the HUGE Flag, the Bullish Bat pattern, and the most important, the ABC correction wave (DONE???) In my opinion BTCUSD is not coming back bellow $10.000 (I could be wrong, but let's hope not.) The green square marks the perfect zone to buy-in, I doubt we will get back to it again any time soon.
I know the XABCD values aren't perfect nor is the Flag but I just wanted to share a quick sketch of whats happening.
Trade Safe!
Anmerkung
A little thing I noticed as well, this last 3 candles show us a interesting thing, the first of the three last (big red one inside the square) has a Low of $10.1k and a close of $11.3k (shows buy pressure) which means people aren't letting the coin dropping more (kind of a "resistance") same happens on the "middle" candle, a Low of $9.2k and a close on $11.1k a BIG jump, that means a BIG buying pressure "pumping" Bitcoin and not letting it drop. The last candle (daily chart) closing above the Close and/or the High of the candle before it (High was $11.7k and the Close was $11.1k would be a nice bullish sign!
Lets see what happens! Trade Safe!
Anmerkung
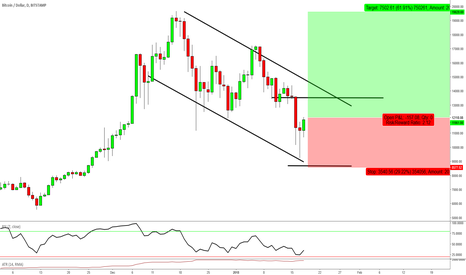
I advise you to watch this video! Great one!
Anmerkung
Expect a drop on BTCUSD to around $10.500, if it breaks that level we might be seeing the $9000/$9500 levels again!
Anmerkung
steemit.com/cryptocurrency/@budz82/coincidence-multi-year-bitcoin-crash-pattern-like-clockwork-btc-has-crashed-25-35-for-4-years-in-a-row-23-24-days-before-chinese Interesting article about timing and events...Anmerkung
Wait for a breakout on either sides, don't get fooled by false breakouts!
It should go up in a short-term!
Trade Safe!
Anmerkung
Forgot to mention it is an Ascending Triangle, but we can see triple tops and double bottoms inside of it..At this time I would just wait patiently !
Anmerkung
WARNING BTC is on top of the support.
1H TF if the candle closes bellow the Yellow line we could see a drop, be careful!
Anmerkung
It went there 2 times already, this would be the third time, let's see if it holds, this is an ascending triangle so (in theory) price should go up, but we are talking about bitcoin... There's always the possibility of breakout on the bottom line thus meaning the price would go down..Anmerkung
Bounce upwards on that "support" broke out of an ascending triangle an of a symmetrical one! Strong jump, it will be followed by a small retracement that has already started.
Anmerkung
Price will go down soon
Anmerkung
If it doesn't bounce back on the Rising wedge line expect an even bigger drop to the 10k levels!!Anmerkung
Tenkan already crossed Kijun upwards on 1H 2H 3H 4H TF and its heading there on the 8H TF (Bigger TF for Ichimoku the better!) We should see a rise in priceAnmerkung
Forgot to mention that on the last picture i shared 2H ago of the rising wedge the price of Bitcoin bounced on the tenkan line!Anmerkung
1H* ^ (My mistake sorry)Anmerkung
TF of 1H Ichimoku is full bullish! Price is bouncing on the Tenkan Line
Anmerkung
At 1H TF Ichimoku shows Bullish!
Careful if price drops (and closes) bellow the Kijun (Red Line)
Anmerkung
Price bouncing on the Tenakn (Blue Line) for the last 9 hours, good sign, it means its holding there on the "support" which is the TenkanAnmerkung
Price made a resistance on that Yellow line, went there 2 times but failed, when it was expected to go there a third time the price was rejected by the cloud on 12h which is a decent TF to use Ichimoku safely. More updates to come.
Anmerkung
Broke out of the Rising wedge originated on a downtrend so the main downtrend will continue
Anmerkung
ABC done?
Price was reject by cloud on the 1D TF, Ichimoku shows Bearish. Price should drop to one of those supports, as I've said before I don't think we'll be seeing the 9K again.
I could be wrong but lets hope not.
Trade safe!
Anmerkung
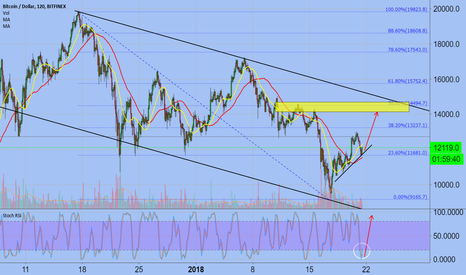
Agreed with EXCAVO
Anmerkung
BTCUSD is inside a giant Bullish Flag! We just need to wait for it to breakout!Anmerkung
Small Symmetrical Triangle, price up
Anmerkung
New rising wedge, price up
Anmerkung
MA100 will cross MA200 (??) maybe price up.
Anmerkung
MA100=PinkMA200=Blue
Anmerkung
Price broke down the channel. Bearish Flag done so price will drop.
Anmerkung
1D TF if the candle closes like this we have Bearish Engulfing. Price drop.
Anmerkung
Price rejected by could at 1D Ichimoku, low power.Anmerkung
(Rejected 2 days in a row)Anmerkung
BTCUSD 1W TF (Long TF means Ichimoku is powerful)
If price closes bellow Kijun we see BTC drop hard back to the 8k/9k levels.
Anmerkung
With this scenario BTC target is probably 8k/8.5kAnmerkung
Fibonacci Retracement, this is what will happen if BTC closes like this or worse.
Anmerkung
This Idea will stop being updated.I've made a new one on which I'll only post "important" Updates.
Heres the link:
Anmerkung
(If you click the image you'll get redirected to the new idea)Anmerkung
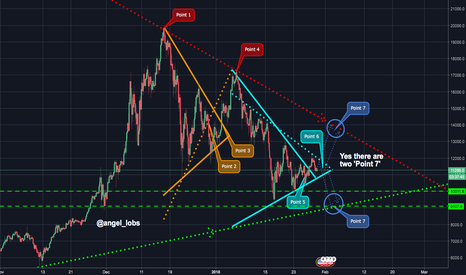
New TA!

Verbundene Veröffentlichungen
Haftungsausschluss
Die Informationen und Veröffentlichungen sind nicht als Finanz-, Anlage-, Handels- oder andere Arten von Ratschlägen oder Empfehlungen gedacht, die von TradingView bereitgestellt oder gebilligt werden, und stellen diese nicht dar. Lesen Sie mehr in den Nutzungsbedingungen.
Verbundene Veröffentlichungen
Haftungsausschluss
Die Informationen und Veröffentlichungen sind nicht als Finanz-, Anlage-, Handels- oder andere Arten von Ratschlägen oder Empfehlungen gedacht, die von TradingView bereitgestellt oder gebilligt werden, und stellen diese nicht dar. Lesen Sie mehr in den Nutzungsbedingungen.