
It always surprises me how lazy technical analysis has become. What has TA turned into? Google image search "bearish pattern" → draw two parallel lines → post for engagement.
Let's go candle by candle since nobody else will:
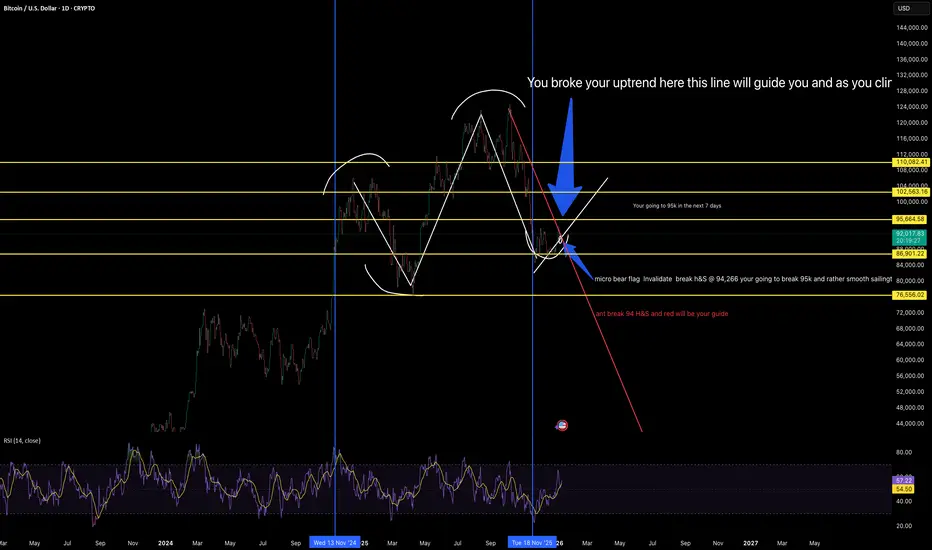
Within this "bearish pennant" - which depending on how you draw your trendlines is ALSO clearly a rising wedge - there are about 80 different patterns unfolding. But sure, let's talk about the one pattern your dog could identify.
Here's what kills me: Did anyone mention the micro head and shoulders forming inside this structure? No? Just lazy bear flag posts? Nobody's talking about the patterns within the pattern.
THE STRUCTURE:
Cup & Handle, inverses etc forming inside a Rising Wedge
Inside a Rounded Triple Bottom
Forming the right shoulder of a macro Inverse Head & Shoulders
Micro H&S within the current consolidation
Neckline sits at 97.5K
Broken uptrend now acting as a MAGNET - price will hug this line on the way back up
THE LEVELS (since nobody else gave you any):
Invalidation: 94,266 - Break this and the micro H&S fails
Target 1: 95K - Within 7 days
Target 2: 105K - Within 30 days if structure holds
If bearish plays out: 76,556 zone - If that micro H&S breaks down, there's room for one more push lower
THE REALITY:
In this market you have to adapt like water. If 94,266 breaks and the micro H&S plays out bearish, there's room for a final push down. I'm not married to a direction - I'm married to levels and structure. The market will tell you what it wants to do.
But here's what I know: if you're posting bear flags, you better be short. Post your positions or don't post at all. It's complete nonsense if you can't stand on what you post.
I'm long here.
That's the difference. I'm telling you my position, my invalidation, and my targets. Where's yours?
To the bear flag crowd:
Go take your shorts. Post your entries. Show me your stop loss. Explain the logic behind your actual bearish formation beyond "it looks like the picture I googled."
Give me specific invalidation levels. Tell me where you're wrong. Otherwise you're just posting for likes while real traders are positioning.
95K in 7 days. 105K in 30. I'm long.
Your move.
Let's go candle by candle since nobody else will:
Within this "bearish pennant" - which depending on how you draw your trendlines is ALSO clearly a rising wedge - there are about 80 different patterns unfolding. But sure, let's talk about the one pattern your dog could identify.
Here's what kills me: Did anyone mention the micro head and shoulders forming inside this structure? No? Just lazy bear flag posts? Nobody's talking about the patterns within the pattern.
THE STRUCTURE:
Cup & Handle, inverses etc forming inside a Rising Wedge
Inside a Rounded Triple Bottom
Forming the right shoulder of a macro Inverse Head & Shoulders
Micro H&S within the current consolidation
Neckline sits at 97.5K
Broken uptrend now acting as a MAGNET - price will hug this line on the way back up
THE LEVELS (since nobody else gave you any):
Invalidation: 94,266 - Break this and the micro H&S fails
Target 1: 95K - Within 7 days
Target 2: 105K - Within 30 days if structure holds
If bearish plays out: 76,556 zone - If that micro H&S breaks down, there's room for one more push lower
THE REALITY:
In this market you have to adapt like water. If 94,266 breaks and the micro H&S plays out bearish, there's room for a final push down. I'm not married to a direction - I'm married to levels and structure. The market will tell you what it wants to do.
But here's what I know: if you're posting bear flags, you better be short. Post your positions or don't post at all. It's complete nonsense if you can't stand on what you post.
I'm long here.
That's the difference. I'm telling you my position, my invalidation, and my targets. Where's yours?
To the bear flag crowd:
Go take your shorts. Post your entries. Show me your stop loss. Explain the logic behind your actual bearish formation beyond "it looks like the picture I googled."
Give me specific invalidation levels. Tell me where you're wrong. Otherwise you're just posting for likes while real traders are positioning.
95K in 7 days. 105K in 30. I'm long.
Your move.
Anmerkung
Bitcoin is at 95k. Where are you lazy traders who said "bEaR FlAg"/ That's the difference. When you know what your looking at you see through the signals that most others can't see. It's not enough to call a "bEaR FlaG". It's really like most traders don't know how to chart and it's truly scary. Maybe that's why people are constantly losing money. Did you know within a "BeAr FlaG" There's several other different patterns? Maybe next time do some better TA. I'm suprised TradingView doesn't ever promote my post that are always spot on but then highlights someone drawing a nice looking chart that goes nowhere. There should be really dedicated and promoted chart's for people who perform beyond technical analysis. There's Levels to this sH***Anmerkung
94k*Anmerkung
95k Boom Got em
Dull entries always miss the mark, Hollow Points Always expand.
discord.gg/nobodyfutures
youtube.com/@hollowpointtrading
discord.gg/nobodyfutures
youtube.com/@hollowpointtrading
Haftungsausschluss
Die Informationen und Veröffentlichungen sind nicht als Finanz-, Anlage-, Handels- oder andere Arten von Ratschlägen oder Empfehlungen gedacht, die von TradingView bereitgestellt oder gebilligt werden, und stellen diese nicht dar. Lesen Sie mehr in den Nutzungsbedingungen.
Dull entries always miss the mark, Hollow Points Always expand.
discord.gg/nobodyfutures
youtube.com/@hollowpointtrading
discord.gg/nobodyfutures
youtube.com/@hollowpointtrading
Haftungsausschluss
Die Informationen und Veröffentlichungen sind nicht als Finanz-, Anlage-, Handels- oder andere Arten von Ratschlägen oder Empfehlungen gedacht, die von TradingView bereitgestellt oder gebilligt werden, und stellen diese nicht dar. Lesen Sie mehr in den Nutzungsbedingungen.