
Description:
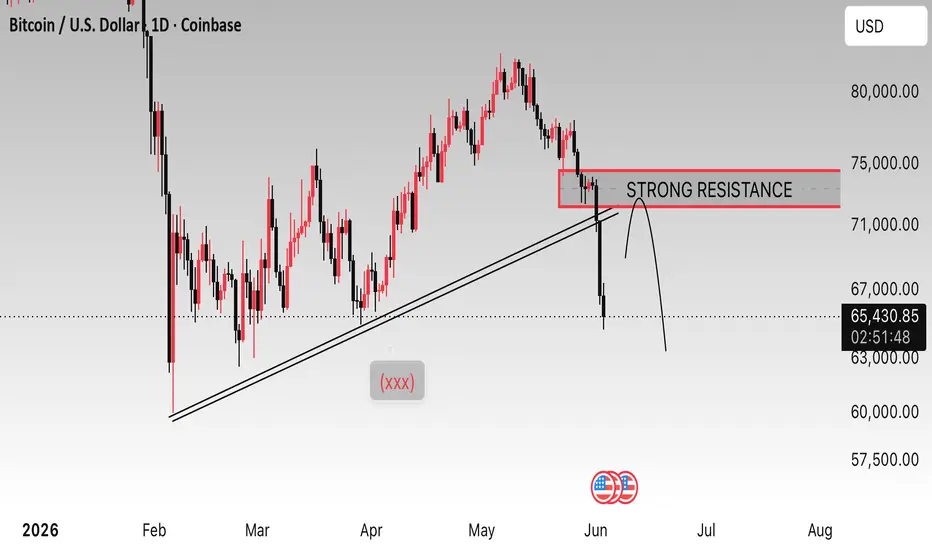
This daily Bitcoin (BTC/USD) chart shows a decisive rejection from a major resistance zone around $72,000–$74,000. Price has broken below a key ascending trendline that previously supported the uptrend, signaling weakening bullish momentum. The highlighted resistance area remains a critical level to watch, and any retest could attract renewed selling pressure. If the breakdown is confirmed, Bitcoin may face further downside toward lower support levels in the coming sessions.
Not financial advice

Haftungsausschluss
Die Informationen und Veröffentlichungen sind nicht als Finanz-, Anlage-, Handels- oder andere Arten von Ratschlägen oder Empfehlungen gedacht, die von TradingView bereitgestellt oder gebilligt werden, und stellen diese nicht dar. Lesen Sie mehr in den Nutzungsbedingungen.
Haftungsausschluss
Die Informationen und Veröffentlichungen sind nicht als Finanz-, Anlage-, Handels- oder andere Arten von Ratschlägen oder Empfehlungen gedacht, die von TradingView bereitgestellt oder gebilligt werden, und stellen diese nicht dar. Lesen Sie mehr in den Nutzungsbedingungen.