
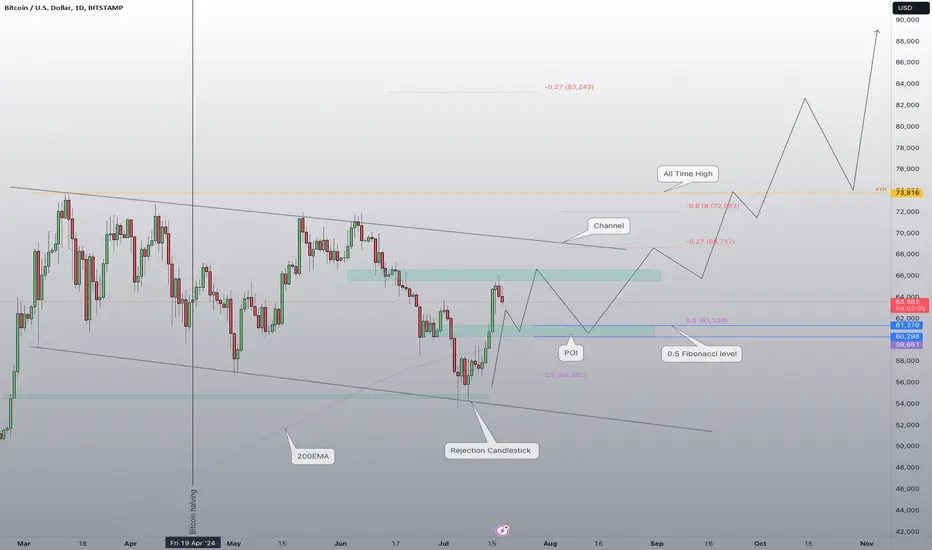
Bitcoin is currently experiencing a pullback after a bullish run lasting nine days. The next strong support zone is between $61,379 and $60,298. I anticipate Bitcoin will fall to this point of interest (POI), where we should see a reaction. There are multiple confluences suggesting a long setup, one of which is Bitcoin trading above the 200-day EMA, an important indicator of strength.

Verbundene Veröffentlichungen
Haftungsausschluss
Die Informationen und Veröffentlichungen sind nicht als Finanz-, Anlage-, Handels- oder andere Arten von Ratschlägen oder Empfehlungen gedacht, die von TradingView bereitgestellt oder gebilligt werden, und stellen diese nicht dar. Lesen Sie mehr in den Nutzungsbedingungen.