
 BTCUSDT.P
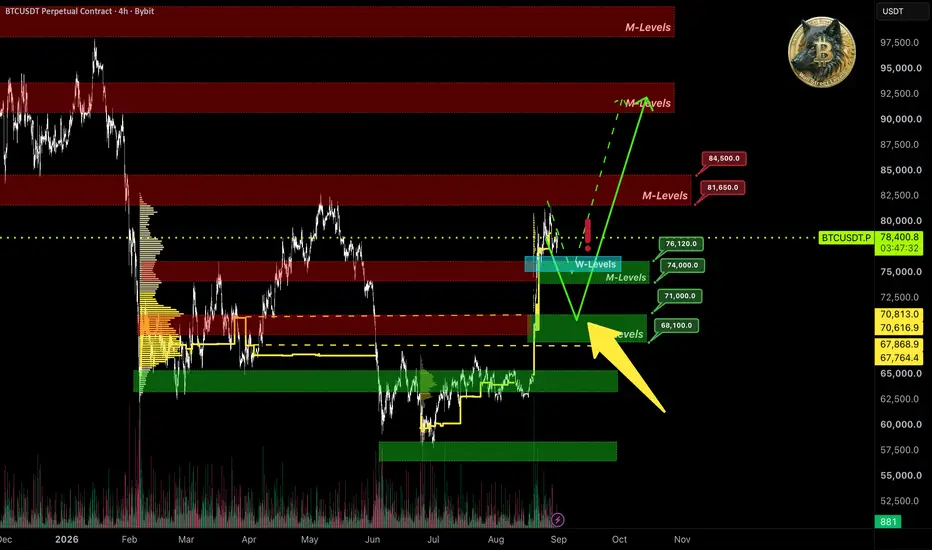
As seen on the chart, price continues trading between monthly 📊M-Levels, showing no clear direction.
🧩IMA data shows that after the bounce from resistance, 🐋large players partially took profits on their longs. Meanwhile, capital outflow from the spot market continued.
The shortened Sunday 🇺🇸US session didn't give a clear signal on market sentiment. Right now, it's important to see what the full Monday session shows.
Judging by 🐋large players' behavior, the monthly support at 📊M-Levels $74000–$76000 is highly likely to get broken. In that case, we can expect price to drop into the $68000–$70000 area, which lines up with the volume level.
If the idea was useful — glad to have your support 🚀.
📊M-Levels — institutional interest levels.
🧩IMA — Integrated Market Analysis
⚠️ Closed algorithms don't show on the chart. Only key levels are displayed.

More trading signals in my channel: t.me/well_street_levels
Verbundene Veröffentlichungen
Haftungsausschluss
Die Informationen und Veröffentlichungen sind nicht als Finanz-, Anlage-, Handels- oder andere Arten von Ratschlägen oder Empfehlungen gedacht, die von TradingView bereitgestellt oder gebilligt werden, und stellen diese nicht dar. Lesen Sie mehr in den Nutzungsbedingungen.