
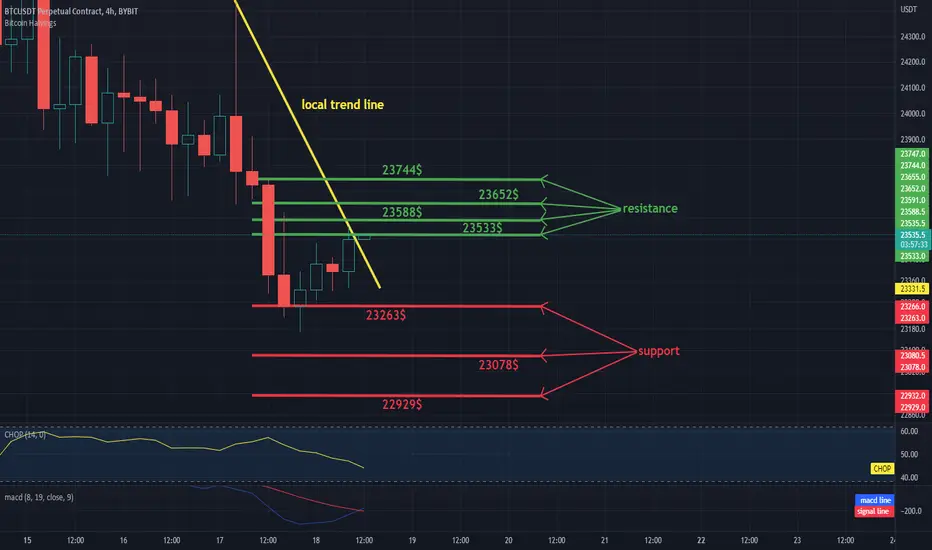
Hello everyone, let's take a look at the BTC to USDT chart over the 4 hour timeframe. As you can see, the price is moving below the local downtrend line.
Let's start with the designation of the support line and as you can see the first support in the near future is $ 23,263, if the support breaks down, the next support is $ 23,078 and $ 22,929.
Now let's move from the resistance line as you can see the first resistance is $ 23,533, if you can break it the next resistance will be $ 23,588, $ 23,652 and $ 23,744.
Looking at the CHOP indicator, we can see that in the 4-hour interval most of the energy has been used and the MACD indicator shows the local change of the trend into an upward trend.
Let's start with the designation of the support line and as you can see the first support in the near future is $ 23,263, if the support breaks down, the next support is $ 23,078 and $ 22,929.
Now let's move from the resistance line as you can see the first resistance is $ 23,533, if you can break it the next resistance will be $ 23,588, $ 23,652 and $ 23,744.
Looking at the CHOP indicator, we can see that in the 4-hour interval most of the energy has been used and the MACD indicator shows the local change of the trend into an upward trend.

Haftungsausschluss
Die Informationen und Veröffentlichungen sind nicht als Finanz-, Anlage-, Handels- oder andere Arten von Ratschlägen oder Empfehlungen gedacht, die von TradingView bereitgestellt oder gebilligt werden, und stellen diese nicht dar. Lesen Sie mehr in den Nutzungsbedingungen.
Haftungsausschluss
Die Informationen und Veröffentlichungen sind nicht als Finanz-, Anlage-, Handels- oder andere Arten von Ratschlägen oder Empfehlungen gedacht, die von TradingView bereitgestellt oder gebilligt werden, und stellen diese nicht dar. Lesen Sie mehr in den Nutzungsbedingungen.