
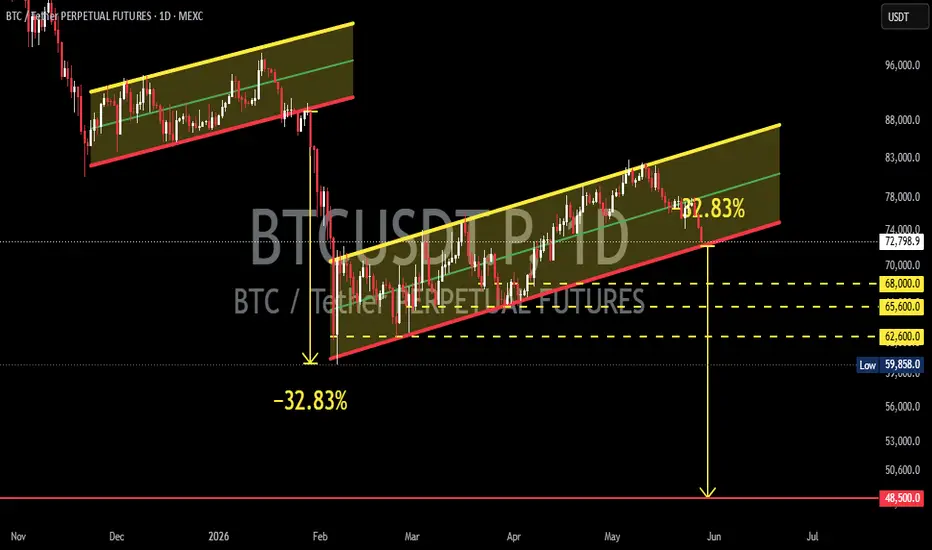
This BTCUSDT 1D timeframe chart clearly shows a Bear Flag Pattern after a sharp previous decline. This pattern is typically considered a bearish continuation pattern, where price consolidates upward inside a channel before potentially continuing the next downward move. 📊
On the chart, BTC is moving inside an ascending channel after experiencing a major dump of around -32.83% previously. Price is now revisiting the lower channel support and beginning to show strong selling pressure again. ⚠️
━━━━━━━━━━━━━━━━━━
📉 Pattern Explanation: Bear Flag 🐻🚩
A Bear Flag consists of 2 main phases:
🟥 Flagpole
The initial sharp decline that forms the “flagpole”.
In this chart:
🔻 A major dump of around -32.83% occurred previously
🔻 Indicates strong seller dominance
🔻 Becomes the basis for the next bearish projection
🟨 Flag / Ascending Channel
After the sharp decline, price slowly moves upward inside an ascending channel. 📈
Typical characteristics:
📌 Volume usually weakens
📌 The upward move is only a retracement
📌 Buyers appear weak and unable to create a strong breakout
Currently, price appears to:
⚠️ Fail to hold the mid-channel area
⚠️ Break down from minor support
⚠️ Test the main lower channel support
━━━━━━━━━━━━━━━━━━
📌 Important Areas on the Chart 🎯
🔴 Main Support Levels
📍 68,000
📍 65,600
📍 62,600
These areas become critical zones before a deeper breakdown could occur. 📉
🔻 Major Bearish Target
If the Bear Flag confirms a full breakdown, the projected downside target could be:
🎯 48,500
This target is derived from:
📏 Previous flagpole projection
📏 Measured move of the Bear Flag pattern
━━━━━━━━━━━━━━━━━━
🐂 Bullish Scenario 🚀
A bullish scenario is still possible if:
✅ Price manages to hold the lower channel support
✅ BTC reclaims the 74K–76K area
✅ A valid breakout above the upper channel occurs
✅ Buyer volume increases significantly
If the breakout succeeds:
🚀 Price could potentially revisit:
🎯 78K
🎯 83K
🎯 Even retest the upper channel resistance
However, as long as price remains inside the Bear Flag structure, bullish movement is still considered a relief rally. ⚠️
━━━━━━━━━━━━━━━━━━
🐻 Bearish Scenario 📉
Bearish momentum becomes the dominant scenario if:
❌ Channel support gets broken
❌ Daily candle closes below the red trendline
❌ Selling volume increases
❌ The 68K area fails to hold
If a breakdown happens:
💥 Panic selling pressure could increase
💥 Gradual downside targets:
🔻 68K
🔻 65.6K
🔻 62.6K
🔻 Up to the extreme target at 48.5K
The current structure still supports bearish pressure unless a strong breakout above the channel occurs. 📊
━━━━━━━━━━━━━━━━━━
⚠️ Conclusion
BTC is currently positioned at a crucial area within a Bear Flag pattern that could determine the next major market direction. 👀
📌 A breakdown below channel support could confirm continuation of the bearish trend.
📌 On the other hand, a breakout above the channel would temporarily invalidate the Bear Flag structure.
The next few daily candles will be very important in determining whether BTC continues a major correction or begins a reversal. 🔥
━━━━━━━━━━━━━━━━━━
#BTC #Bitcoin #BTCUSDT #Crypto #TechnicalAnalysis #BearFlag #BitcoinCrash #CryptoTrading #PriceAction #SupportResistance #Bearish #Trading #CryptoMarket #BTCAnalysis #ChartPattern #Altcoin #MarketStructure #Trader #BitcoinAnalysis
On the chart, BTC is moving inside an ascending channel after experiencing a major dump of around -32.83% previously. Price is now revisiting the lower channel support and beginning to show strong selling pressure again. ⚠️
━━━━━━━━━━━━━━━━━━
📉 Pattern Explanation: Bear Flag 🐻🚩
A Bear Flag consists of 2 main phases:
🟥 Flagpole
The initial sharp decline that forms the “flagpole”.
In this chart:
🔻 A major dump of around -32.83% occurred previously
🔻 Indicates strong seller dominance
🔻 Becomes the basis for the next bearish projection
🟨 Flag / Ascending Channel
After the sharp decline, price slowly moves upward inside an ascending channel. 📈
Typical characteristics:
📌 Volume usually weakens
📌 The upward move is only a retracement
📌 Buyers appear weak and unable to create a strong breakout
Currently, price appears to:
⚠️ Fail to hold the mid-channel area
⚠️ Break down from minor support
⚠️ Test the main lower channel support
━━━━━━━━━━━━━━━━━━
📌 Important Areas on the Chart 🎯
🔴 Main Support Levels
📍 68,000
📍 65,600
📍 62,600
These areas become critical zones before a deeper breakdown could occur. 📉
🔻 Major Bearish Target
If the Bear Flag confirms a full breakdown, the projected downside target could be:
🎯 48,500
This target is derived from:
📏 Previous flagpole projection
📏 Measured move of the Bear Flag pattern
━━━━━━━━━━━━━━━━━━
🐂 Bullish Scenario 🚀
A bullish scenario is still possible if:
✅ Price manages to hold the lower channel support
✅ BTC reclaims the 74K–76K area
✅ A valid breakout above the upper channel occurs
✅ Buyer volume increases significantly
If the breakout succeeds:
🚀 Price could potentially revisit:
🎯 78K
🎯 83K
🎯 Even retest the upper channel resistance
However, as long as price remains inside the Bear Flag structure, bullish movement is still considered a relief rally. ⚠️
━━━━━━━━━━━━━━━━━━
🐻 Bearish Scenario 📉
Bearish momentum becomes the dominant scenario if:
❌ Channel support gets broken
❌ Daily candle closes below the red trendline
❌ Selling volume increases
❌ The 68K area fails to hold
If a breakdown happens:
💥 Panic selling pressure could increase
💥 Gradual downside targets:
🔻 68K
🔻 65.6K
🔻 62.6K
🔻 Up to the extreme target at 48.5K
The current structure still supports bearish pressure unless a strong breakout above the channel occurs. 📊
━━━━━━━━━━━━━━━━━━
⚠️ Conclusion
BTC is currently positioned at a crucial area within a Bear Flag pattern that could determine the next major market direction. 👀
📌 A breakdown below channel support could confirm continuation of the bearish trend.
📌 On the other hand, a breakout above the channel would temporarily invalidate the Bear Flag structure.
The next few daily candles will be very important in determining whether BTC continues a major correction or begins a reversal. 🔥
━━━━━━━━━━━━━━━━━━
#BTC #Bitcoin #BTCUSDT #Crypto #TechnicalAnalysis #BearFlag #BitcoinCrash #CryptoTrading #PriceAction #SupportResistance #Bearish #Trading #CryptoMarket #BTCAnalysis #ChartPattern #Altcoin #MarketStructure #Trader #BitcoinAnalysis

✅ Get Free Signals! Join Our Telegram Channel Here: t.me/TheCryptoNuclear
✅ Twitter: twitter.com/crypto_nuclear
✅ Join Bybit : partner.bybit.com/b/nuclearvip
✅ Benefits : Lifetime Trading Fee Discount -50%
✅ Twitter: twitter.com/crypto_nuclear
✅ Join Bybit : partner.bybit.com/b/nuclearvip
✅ Benefits : Lifetime Trading Fee Discount -50%
Haftungsausschluss
Die Informationen und Veröffentlichungen sind nicht als Finanz-, Anlage-, Handels- oder andere Arten von Ratschlägen oder Empfehlungen gedacht, die von TradingView bereitgestellt oder gebilligt werden, und stellen diese nicht dar. Lesen Sie mehr in den Nutzungsbedingungen.
✅ Get Free Signals! Join Our Telegram Channel Here: t.me/TheCryptoNuclear
✅ Twitter: twitter.com/crypto_nuclear
✅ Join Bybit : partner.bybit.com/b/nuclearvip
✅ Benefits : Lifetime Trading Fee Discount -50%
✅ Twitter: twitter.com/crypto_nuclear
✅ Join Bybit : partner.bybit.com/b/nuclearvip
✅ Benefits : Lifetime Trading Fee Discount -50%
Haftungsausschluss
Die Informationen und Veröffentlichungen sind nicht als Finanz-, Anlage-, Handels- oder andere Arten von Ratschlägen oder Empfehlungen gedacht, die von TradingView bereitgestellt oder gebilligt werden, und stellen diese nicht dar. Lesen Sie mehr in den Nutzungsbedingungen.