
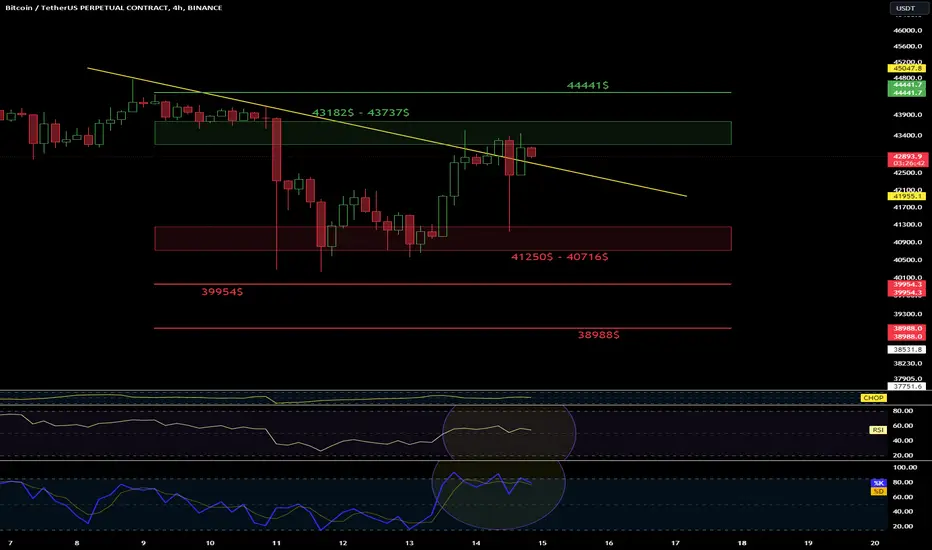
Hello everyone, let's take a look at the BTC to USDT chart on a four-hour time frame. As you can see, the price has returned and remains on the local downtrend line.
When we unfold the Trend-Based Fib Extension grid, we can determine the support zone from $41,250 to $40,716, then support at $39,954, and further support at $38,988.
Looking the other way, there is a strong resistance zone from $43,182 to $43,737, followed by strong resistance around $44,441.
On the RSI indicator, we remain in the middle of the range, but on the STOCH indicator, we are moving at the upper limit, which may result in a price recovery.
When we unfold the Trend-Based Fib Extension grid, we can determine the support zone from $41,250 to $40,716, then support at $39,954, and further support at $38,988.
Looking the other way, there is a strong resistance zone from $43,182 to $43,737, followed by strong resistance around $44,441.
On the RSI indicator, we remain in the middle of the range, but on the STOCH indicator, we are moving at the upper limit, which may result in a price recovery.

Haftungsausschluss
Die Informationen und Veröffentlichungen sind nicht als Finanz-, Anlage-, Handels- oder andere Arten von Ratschlägen oder Empfehlungen gedacht, die von TradingView bereitgestellt oder gebilligt werden, und stellen diese nicht dar. Lesen Sie mehr in den Nutzungsbedingungen.
Haftungsausschluss
Die Informationen und Veröffentlichungen sind nicht als Finanz-, Anlage-, Handels- oder andere Arten von Ratschlägen oder Empfehlungen gedacht, die von TradingView bereitgestellt oder gebilligt werden, und stellen diese nicht dar. Lesen Sie mehr in den Nutzungsbedingungen.