
Bitcoin Liquidity Roadmap – Market Maker Liquidity Sweep & Bearish Bias
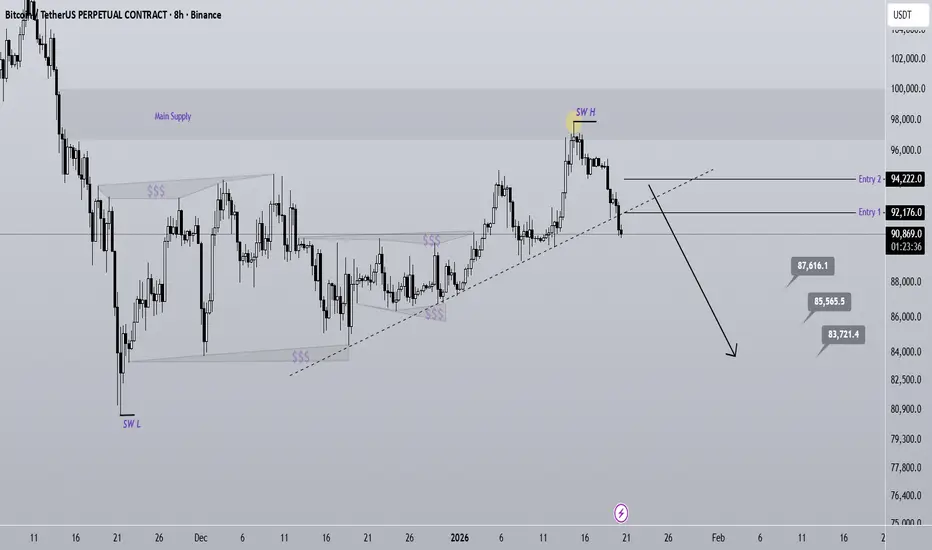
Market makers have created a well-defined zone to accumulate liquidity from both buyers and sellers. On the chart, we have clearly marked the liquidity areas, which essentially act as liquidity pools that market makers target.
Liquidity Pools & Sweep Zones
Two liquidity pools above price have already been swept, indicating that the market has absorbed buy-side liquidity. Following this sweep, the price has reached a strong supply zone and the trendline support has been broken. This combination is a powerful bearish signal, especially when confirmed by a structural breakdown.
Daily Timeframe: Bearish Trend Confirmation
It is also important to analyze the trend on the daily timeframe and lower. We need to determine whether the market is in a bullish or bearish phase. From the ATH (All-Time High) until now, Bitcoin has been dropping continuously without a meaningful recovery, which suggests that the daily and lower timeframes are currently bearish.
Current Market Scenario: Sweeping Lower Liquidity Pools
Right now, Bitcoin is attempting to sweep two lower liquidity pools after having already swept the two higher ones. This implies a continuation of the market maker liquidity hunt, and the current structure is clearly favoring sellers.
CME Gap: 88K Level
Additionally, we know there is a CME gap around the 88K level, which often acts as a magnet for price action in the medium term. This gap increases the likelihood of downward continuation if sellers remain in control.
All Signs Point to Sellers
At this moment, all technical signals are aligning in favor of the bearish side. The market structure, liquidity sweep, trendline break, and daily bearish bias all suggest further downside potential.
Entry Strategy: DCA (Dollar-Cost Averaging)
We have identified two entry zones for short positions. The best approach is to enter using DCA to minimize risk and maximize position efficiency. This allows traders to build a position gradually rather than risking a single entry at a potentially unfavorable level.
Invalidating the Analysis
This bearish outlook will be invalidated if Bitcoin closes a daily candle above the liquidation invalidation level. A daily close above this level would break the bearish structure and signal a possible trend reversal or a shift in market sentiment.
invalidation level: 97300$
If you would like us to analyze a coin or altcoin for you, first like this post, then comment the name of your altcoin below.
Market makers have created a well-defined zone to accumulate liquidity from both buyers and sellers. On the chart, we have clearly marked the liquidity areas, which essentially act as liquidity pools that market makers target.
Liquidity Pools & Sweep Zones
Two liquidity pools above price have already been swept, indicating that the market has absorbed buy-side liquidity. Following this sweep, the price has reached a strong supply zone and the trendline support has been broken. This combination is a powerful bearish signal, especially when confirmed by a structural breakdown.
Daily Timeframe: Bearish Trend Confirmation
It is also important to analyze the trend on the daily timeframe and lower. We need to determine whether the market is in a bullish or bearish phase. From the ATH (All-Time High) until now, Bitcoin has been dropping continuously without a meaningful recovery, which suggests that the daily and lower timeframes are currently bearish.
Current Market Scenario: Sweeping Lower Liquidity Pools
Right now, Bitcoin is attempting to sweep two lower liquidity pools after having already swept the two higher ones. This implies a continuation of the market maker liquidity hunt, and the current structure is clearly favoring sellers.
CME Gap: 88K Level
Additionally, we know there is a CME gap around the 88K level, which often acts as a magnet for price action in the medium term. This gap increases the likelihood of downward continuation if sellers remain in control.
All Signs Point to Sellers
At this moment, all technical signals are aligning in favor of the bearish side. The market structure, liquidity sweep, trendline break, and daily bearish bias all suggest further downside potential.
Entry Strategy: DCA (Dollar-Cost Averaging)
We have identified two entry zones for short positions. The best approach is to enter using DCA to minimize risk and maximize position efficiency. This allows traders to build a position gradually rather than risking a single entry at a potentially unfavorable level.
Invalidating the Analysis
This bearish outlook will be invalidated if Bitcoin closes a daily candle above the liquidation invalidation level. A daily close above this level would break the bearish structure and signal a possible trend reversal or a shift in market sentiment.
invalidation level: 97300$
If you would like us to analyze a coin or altcoin for you, first like this post, then comment the name of your altcoin below.

🔥 High profit futures and spot signals are published only on our Telegram
t.me/iMoney_T
🔥 We provide signals and analysis on Telegram hourly and daily
t.me/iMoney_T
🔥 Exclusive signals are only published on our Telegram channels.
t.me/iMoney_T
🔥 We provide signals and analysis on Telegram hourly and daily
t.me/iMoney_T
🔥 Exclusive signals are only published on our Telegram channels.
Haftungsausschluss
Die Informationen und Veröffentlichungen sind nicht als Finanz-, Anlage-, Handels- oder andere Arten von Ratschlägen oder Empfehlungen gedacht, die von TradingView bereitgestellt oder gebilligt werden, und stellen diese nicht dar. Lesen Sie mehr in den Nutzungsbedingungen.
🔥 High profit futures and spot signals are published only on our Telegram
t.me/iMoney_T
🔥 We provide signals and analysis on Telegram hourly and daily
t.me/iMoney_T
🔥 Exclusive signals are only published on our Telegram channels.
t.me/iMoney_T
🔥 We provide signals and analysis on Telegram hourly and daily
t.me/iMoney_T
🔥 Exclusive signals are only published on our Telegram channels.
Haftungsausschluss
Die Informationen und Veröffentlichungen sind nicht als Finanz-, Anlage-, Handels- oder andere Arten von Ratschlägen oder Empfehlungen gedacht, die von TradingView bereitgestellt oder gebilligt werden, und stellen diese nicht dar. Lesen Sie mehr in den Nutzungsbedingungen.