
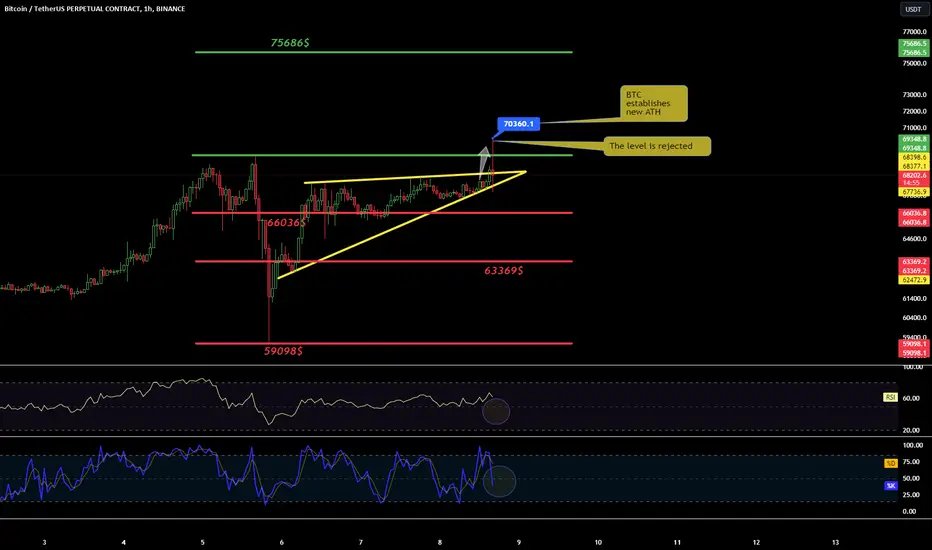
Hello everyone, let's look at the 1H BTC to USDT chart, as you can see we had a strong breakout from the triangle, which gave a new ATH level for BTC.
When the resistance level from the previous ATH was broken and the price established a new ATH at $70,360, if this level was maintained and the resistance was positively tested, it could give an upward impulse to around $75,686.
When a larger recovery begins, we have three significant support levels, the first one is at $66,036, then the second one is visible at $63,369, and then the very important level is $59,098.
If we look at the RSI and STOCH indicators, there is still room for a possible continuation of the recovery.
When the resistance level from the previous ATH was broken and the price established a new ATH at $70,360, if this level was maintained and the resistance was positively tested, it could give an upward impulse to around $75,686.
When a larger recovery begins, we have three significant support levels, the first one is at $66,036, then the second one is visible at $63,369, and then the very important level is $59,098.
If we look at the RSI and STOCH indicators, there is still room for a possible continuation of the recovery.

Haftungsausschluss
Die Informationen und Veröffentlichungen sind nicht als Finanz-, Anlage-, Handels- oder andere Arten von Ratschlägen oder Empfehlungen gedacht, die von TradingView bereitgestellt oder gebilligt werden, und stellen diese nicht dar. Lesen Sie mehr in den Nutzungsbedingungen.
Haftungsausschluss
Die Informationen und Veröffentlichungen sind nicht als Finanz-, Anlage-, Handels- oder andere Arten von Ratschlägen oder Empfehlungen gedacht, die von TradingView bereitgestellt oder gebilligt werden, und stellen diese nicht dar. Lesen Sie mehr in den Nutzungsbedingungen.