It seems history is repeating.
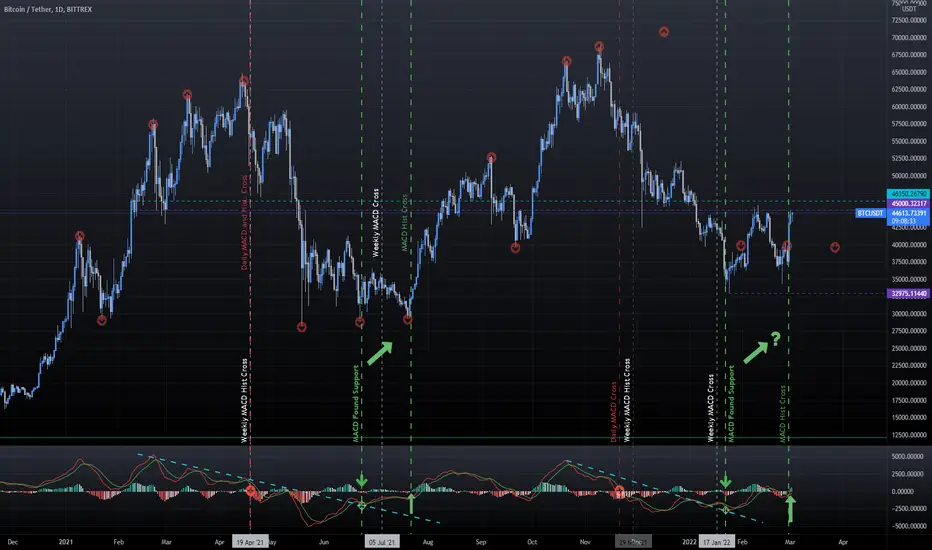
Weekly MACD histogram and daily MACD and histogram crossing negative preceded the crash in May. Daily MACD finding support, followed by the histogram crossing positive marked the start of the rally in August.
The same sequence of events has just completed in the last few days. Time for a bull run?
Weekly MACD histogram and daily MACD and histogram crossing negative preceded the crash in May. Daily MACD finding support, followed by the histogram crossing positive marked the start of the rally in August.
The same sequence of events has just completed in the last few days. Time for a bull run?

Haftungsausschluss
Die Informationen und Veröffentlichungen sind nicht als Finanz-, Anlage-, Handels- oder andere Arten von Ratschlägen oder Empfehlungen gedacht, die von TradingView bereitgestellt oder gebilligt werden, und stellen diese nicht dar. Lesen Sie mehr in den Nutzungsbedingungen.
Haftungsausschluss
Die Informationen und Veröffentlichungen sind nicht als Finanz-, Anlage-, Handels- oder andere Arten von Ratschlägen oder Empfehlungen gedacht, die von TradingView bereitgestellt oder gebilligt werden, und stellen diese nicht dar. Lesen Sie mehr in den Nutzungsbedingungen.