
Monthly Chart

The price has moved below the lower boundary of the last buyer initiative at 74,508 and also dipped below the low of the November 2024 buyer candle (66,835).
That November candle remains the highest-volume buyer candle from April 2024 through January 2026. It will be important to see what volume forms in February 2026.
The 74,508 level is now a key reference.
Weekly Chart
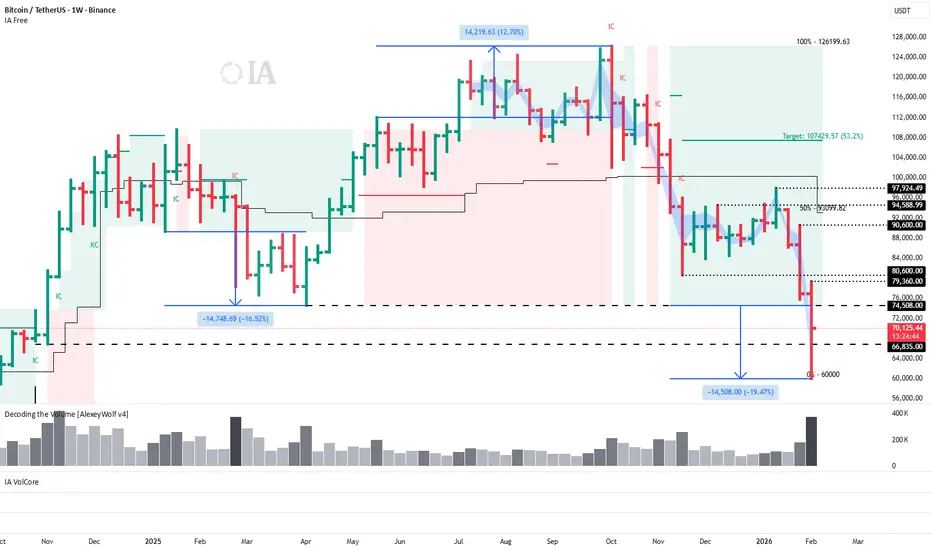
A sideways range has been forming on the weekly timeframe since January 2025.
The chart shows a nearly symmetrical expansion of this range:
This symmetry likely points to stabilization within a broad price range of 60,000–126,000.
The volume of the latest weekly candle is notable. While it is still below the volume of the February 24, 2025 candle, the week has not yet closed and may exceed it.
This suggests solid demand for Bitcoin at current price levels.
Key resistance levels are marked on the chart.
Conclusion:
From a conservative perspective, long positions can be considered once buyers reclaim the seller candle on the weekly timeframe — that is, with a close above 79,360.
Until then, it makes sense to focus on local setups on lower timeframes, as the price may consolidate in this area for several weeks.
Profitable trades!
This analysis is based on the Initiative Analysis (IA) method.
The price has moved below the lower boundary of the last buyer initiative at 74,508 and also dipped below the low of the November 2024 buyer candle (66,835).
That November candle remains the highest-volume buyer candle from April 2024 through January 2026. It will be important to see what volume forms in February 2026.
The 74,508 level is now a key reference.
Weekly Chart
A sideways range has been forming on the weekly timeframe since January 2025.
The chart shows a nearly symmetrical expansion of this range:
- first downward by about 14,700
- then upward by 14,200
- and now downward again by roughly 14,500.
This symmetry likely points to stabilization within a broad price range of 60,000–126,000.
The volume of the latest weekly candle is notable. While it is still below the volume of the February 24, 2025 candle, the week has not yet closed and may exceed it.
This suggests solid demand for Bitcoin at current price levels.
Key resistance levels are marked on the chart.
Conclusion:
From a conservative perspective, long positions can be considered once buyers reclaim the seller candle on the weekly timeframe — that is, with a close above 79,360.
Until then, it makes sense to focus on local setups on lower timeframes, as the price may consolidate in this area for several weeks.
Profitable trades!
This analysis is based on the Initiative Analysis (IA) method.

Clarity on the Chart. Smart Trading Decisions
Verbundene Veröffentlichungen
Haftungsausschluss
Die Informationen und Veröffentlichungen sind nicht als Finanz-, Anlage-, Handels- oder andere Arten von Ratschlägen oder Empfehlungen gedacht, die von TradingView bereitgestellt oder gebilligt werden, und stellen diese nicht dar. Lesen Sie mehr in den Nutzungsbedingungen.
Clarity on the Chart. Smart Trading Decisions
Verbundene Veröffentlichungen
Haftungsausschluss
Die Informationen und Veröffentlichungen sind nicht als Finanz-, Anlage-, Handels- oder andere Arten von Ratschlägen oder Empfehlungen gedacht, die von TradingView bereitgestellt oder gebilligt werden, und stellen diese nicht dar. Lesen Sie mehr in den Nutzungsbedingungen.