
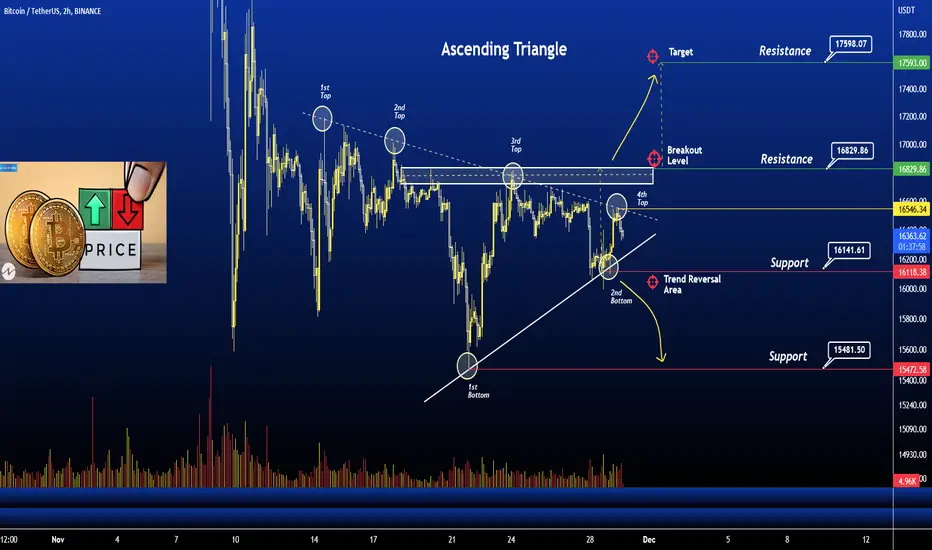
BTC "Ascending Triangle" Breakout
The ascending triangle is a characteristic pattern of an ongoing bullish trend . This triangle is formed by a horizontal upper trend line that connects the highs and the lower trend line that connects the rising lows. If the trend breaks out at the resistance level , the price will continue to move up in this ascending triangle pattern.
Currently, Bitcoin is in the range of $16370. If the pattern continues, the price of HT might reach the resistance levels of $17600 . If the trend reverses, then the price of HT may fall to $15500
Happy Trading

Verbundene Veröffentlichungen
Haftungsausschluss
Die Informationen und Veröffentlichungen sind nicht als Finanz-, Anlage-, Handels- oder andere Arten von Ratschlägen oder Empfehlungen gedacht, die von TradingView bereitgestellt oder gebilligt werden, und stellen diese nicht dar. Lesen Sie mehr in den Nutzungsbedingungen.
Verbundene Veröffentlichungen
Haftungsausschluss
Die Informationen und Veröffentlichungen sind nicht als Finanz-, Anlage-, Handels- oder andere Arten von Ratschlägen oder Empfehlungen gedacht, die von TradingView bereitgestellt oder gebilligt werden, und stellen diese nicht dar. Lesen Sie mehr in den Nutzungsbedingungen.