
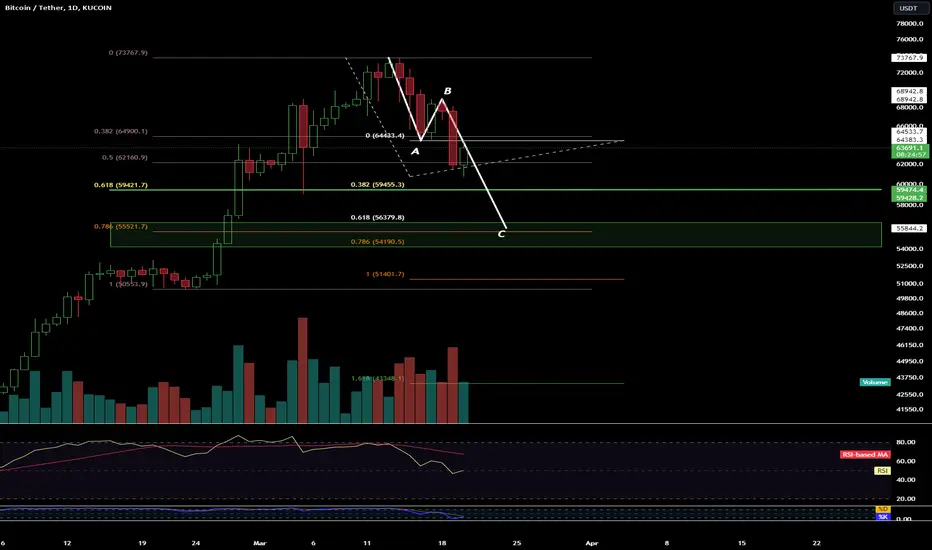
On BTC, you can see the formation of the ABC formation, which would indicate a continuation of the correction to deeper levels.
We can see green candles appearing on the volume, but they are weaker than the red downward ones.
The RSI shows a continuation of the downward movement with room for a greater price recovery.
We can see green candles appearing on the volume, but they are weaker than the red downward ones.
The RSI shows a continuation of the downward movement with room for a greater price recovery.

Haftungsausschluss
Die Informationen und Veröffentlichungen sind nicht als Finanz-, Anlage-, Handels- oder andere Arten von Ratschlägen oder Empfehlungen gedacht, die von TradingView bereitgestellt oder gebilligt werden, und stellen diese nicht dar. Lesen Sie mehr in den Nutzungsbedingungen.
Haftungsausschluss
Die Informationen und Veröffentlichungen sind nicht als Finanz-, Anlage-, Handels- oder andere Arten von Ratschlägen oder Empfehlungen gedacht, die von TradingView bereitgestellt oder gebilligt werden, und stellen diese nicht dar. Lesen Sie mehr in den Nutzungsbedingungen.