
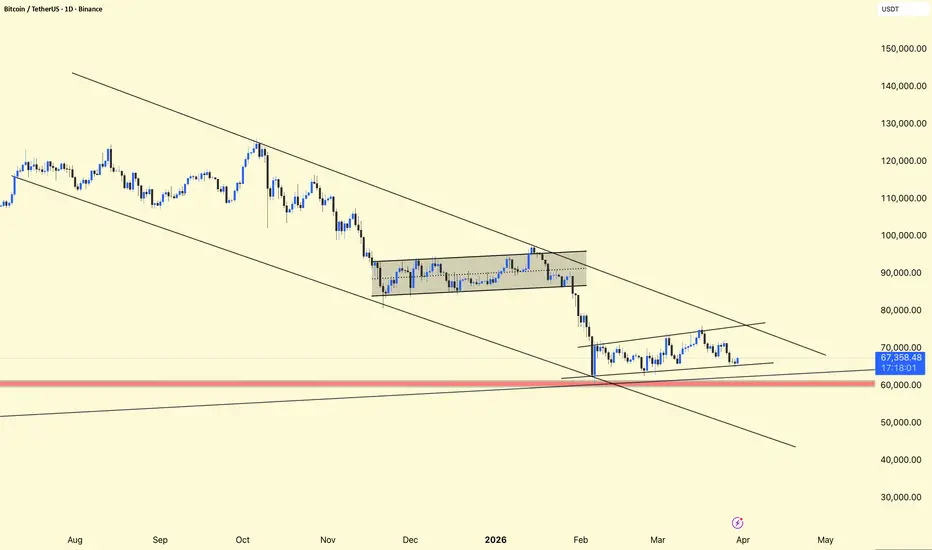
BTCUSDT – Daily Chart Update
Current Structure Price: ~$67.3K
Trading just above major support (~$60K–$62K zone)
Still inside a larger descending channel
Short-term forming a tight consolidation range
Market is compressing after a sharp drop — decision phase
Breakdown from previous range → strong sell-off
Now forming a bear flag / weak recovery structure
Lower highs still intact → trend remains bearish
Bearish Continuation (more likely currently)
Rejection from the $70K area
Break below $60K
Targets:
$55K
Possibly lower if momentum builds
Bullish Reversal (needs confirmation)
Break & hold above $72K
Invalidate the lower high structure
Then move toward:
$78K → $80K
👉 Still bearish until $72K is reclaimed

Verbundene Veröffentlichungen
Haftungsausschluss
Die Informationen und Veröffentlichungen sind nicht als Finanz-, Anlage-, Handels- oder andere Arten von Ratschlägen oder Empfehlungen gedacht, die von TradingView bereitgestellt oder gebilligt werden, und stellen diese nicht dar. Lesen Sie mehr in den Nutzungsbedingungen.