
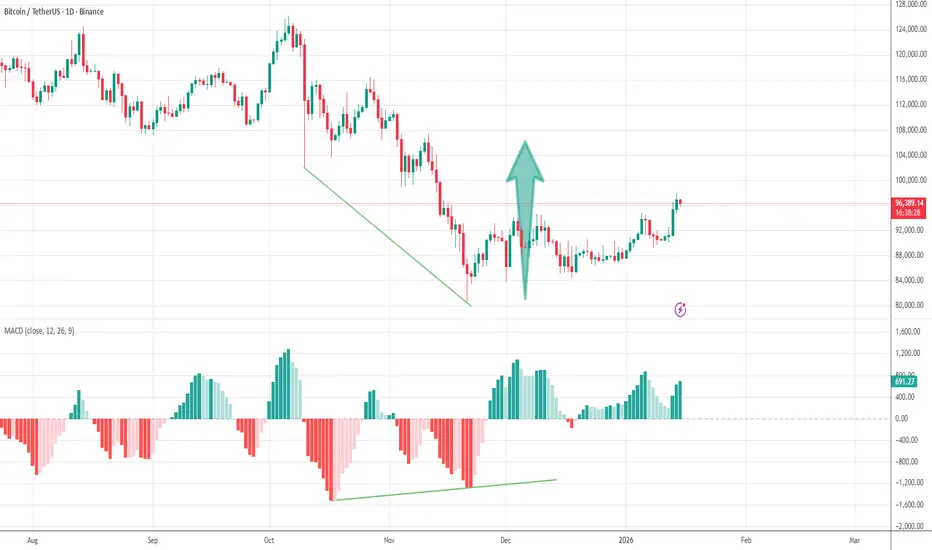
A bullish divergence by Elder’s rules on the daily timeframe often leads to a long-term rise or a market reversal because price may still print lower lows, but the downside momentum is already fading. The oscillator MACD Histogram shows that sellers are losing strength — new lows are made with less “energy.” On the daily chart, this usually reflects a real shift in behavior of large market participants, not just noise.
By Elder’s approach, divergence is not an entry signal — it’s an early warning that the trend is weakening. Professional traders often start covering shorts and gradually building long exposure before the price turns.
Since a daily divergence forms over weeks, it tends to reflect accumulation rather than a random bounce. That’s why the move that follows often becomes not just a pullback, but a sustained medium- to long-term reversal.
By Elder’s approach, divergence is not an entry signal — it’s an early warning that the trend is weakening. Professional traders often start covering shorts and gradually building long exposure before the price turns.
Since a daily divergence forms over weeks, it tends to reflect accumulation rather than a random bounce. That’s why the move that follows often becomes not just a pullback, but a sustained medium- to long-term reversal.

Haftungsausschluss
Die Informationen und Veröffentlichungen sind nicht als Finanz-, Anlage-, Handels- oder andere Arten von Ratschlägen oder Empfehlungen gedacht, die von TradingView bereitgestellt oder gebilligt werden, und stellen diese nicht dar. Lesen Sie mehr in den Nutzungsbedingungen.
Haftungsausschluss
Die Informationen und Veröffentlichungen sind nicht als Finanz-, Anlage-, Handels- oder andere Arten von Ratschlägen oder Empfehlungen gedacht, die von TradingView bereitgestellt oder gebilligt werden, und stellen diese nicht dar. Lesen Sie mehr in den Nutzungsbedingungen.