
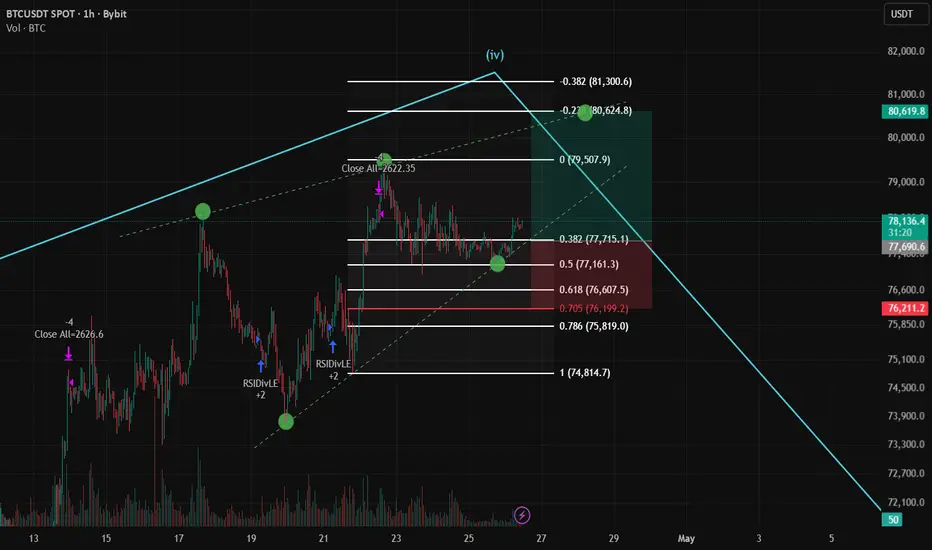
Bitcoin is currently exhibiting a strong bullish recovery on the hourly timeframe. Following a complex corrective phase labeled as Wave (iv), the price has successfully established a support base within the primary Fibonacci retracement zone. With structural momentum shifting back to the upside, we are now looking for a final impulsive expansion to test the $80,000 psychological level.Elliott Wave Structure: * The chart indicates the completion of a deep Wave (iv) correction.
We are now observing the initial stages of Wave (v), characterized by a break above local descending resistance and a successful retest of the value area.
Support: The price found aggressive buyers at the 0.618 - 0.705 Fibonacci "OTE" zone ($76,199 - $76,607).
Resistance/Targets:
Target 1: $79,507 (0 Fib / Recent Local High).
Target 2: $80,624 (-0.238 Fib extension).
Target 3: $81,300 (-0.382 Fib extension).
Momentum Indicators: * The RSI Divergence Indicator confirms multiple bullish signals (noted as "RSIDivLE" on the chart), suggesting that the previous selling pressure has been fully absorbed by institutional demand.
We are now observing the initial stages of Wave (v), characterized by a break above local descending resistance and a successful retest of the value area.
Support: The price found aggressive buyers at the 0.618 - 0.705 Fibonacci "OTE" zone ($76,199 - $76,607).
Resistance/Targets:
Target 1: $79,507 (0 Fib / Recent Local High).
Target 2: $80,624 (-0.238 Fib extension).
Target 3: $81,300 (-0.382 Fib extension).
Momentum Indicators: * The RSI Divergence Indicator confirms multiple bullish signals (noted as "RSIDivLE" on the chart), suggesting that the previous selling pressure has been fully absorbed by institutional demand.

📲Join Honey Badger Trading Bot for free:
Find more analytics and our trading results here - t.me/Neuro_trade_AI_bot?start=Tradingview
HoneyBadger is the Top-1 Master Trader on Bybit TradFi.
Find more analytics and our trading results here - t.me/Neuro_trade_AI_bot?start=Tradingview
HoneyBadger is the Top-1 Master Trader on Bybit TradFi.
Haftungsausschluss
Die Informationen und Veröffentlichungen sind nicht als Finanz-, Anlage-, Handels- oder andere Arten von Ratschlägen oder Empfehlungen gedacht, die von TradingView bereitgestellt oder gebilligt werden, und stellen diese nicht dar. Lesen Sie mehr in den Nutzungsbedingungen.
📲Join Honey Badger Trading Bot for free:
Find more analytics and our trading results here - t.me/Neuro_trade_AI_bot?start=Tradingview
HoneyBadger is the Top-1 Master Trader on Bybit TradFi.
Find more analytics and our trading results here - t.me/Neuro_trade_AI_bot?start=Tradingview
HoneyBadger is the Top-1 Master Trader on Bybit TradFi.
Haftungsausschluss
Die Informationen und Veröffentlichungen sind nicht als Finanz-, Anlage-, Handels- oder andere Arten von Ratschlägen oder Empfehlungen gedacht, die von TradingView bereitgestellt oder gebilligt werden, und stellen diese nicht dar. Lesen Sie mehr in den Nutzungsbedingungen.