
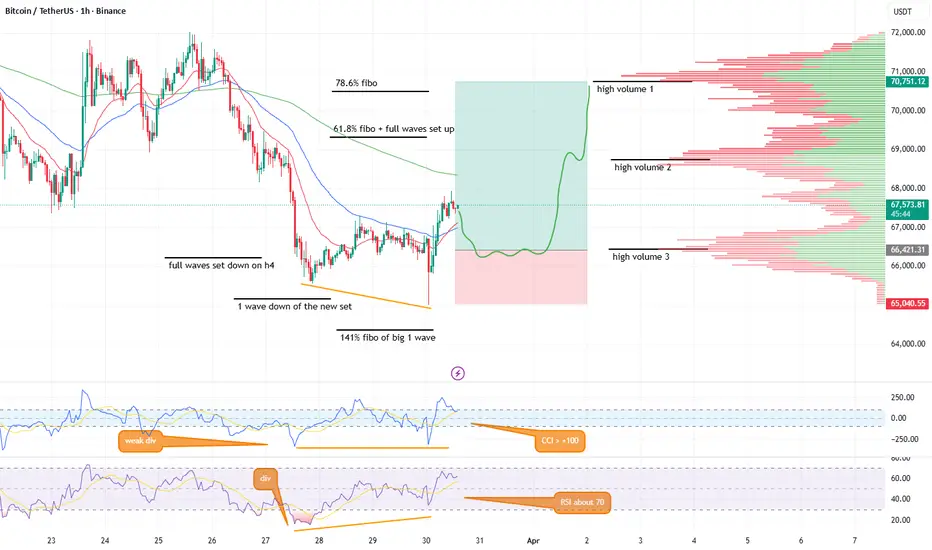
Technical Analysis:
1️⃣СCI - above +100, a decline is needed, followed by another upward move. Weak divergence.
2️⃣RSI - around 70. Also advisable to fall first. There's good divergence.
3️⃣Levels:
🔸High volume 3 = 66,460 + a full set of downward waves on h4 = 66,200 - important resistance
🔸61.8% Fibonacci + a full set of upward waves = 69,350 - potential price stop
🔸High volume 1 = 70,750 + 78.6% Fibonacci = 75,000 - approximate take-profit level.
4️⃣Elder TF (h4) - 50 EMA approximately at the increased volume level 2 = 68770. Another potential resistance point on the way up.
5️⃣Price movement forecast - on the chart.
Entry, stop, take:
🔸Entry: Buy. Breakout above the increased volume level 3 = 66460
🔸Stop: Preliminary beyond the peak of 65020, but may be adjusted, depending on the price action.
🔸Take Profit: high volume 1 = 70,750.
🔸Risk/Reward: 3.14
🔸Execution: Within a week.
Cancellation
🔸No breakout of high volume 3 = 66,460 or a sharp drop to 141% Fibonacci level of the large first wave = 64,400
Fundamentals:
1️⃣ Fear Index: 8 (Extreme Fear, ~7 weeks in a row) → 🟢 Positive for BTC. Longest streak of extreme fear since late 2022. A trigger is needed for an upward move.
2️⃣ BTC Dominance: 56–57% → ⚪ Neutral. Capital favors BTC over altcoins (ETH/BTC 0.030 is a multi-year low).
3️⃣ Funding Rate: negative for almost all of March, has turned slightly positive (+0.0003–0.0005%) in the last 16 hours (Binance API) → 🟢 Positive for BTC. A positive funding reversal could signal the beginning of a sentiment shift.
4️⃣ Open Interest: $102–112B, funding has just turned positive (Binance API) → ⚪ Neutral. A positive funding reversal (since March 29) could mean shorts are starting to close or longs are being added.
5️⃣ Liquidations (March 27): $451M, 122K traders → ⚪ Neutral. There are conditions for an upward move, we are waiting for a trigger.
6️⃣ ETF Flows: -$171M (March 27), week ~-$71M, March $890M vs. $3.3B in February → 🔴 Negative for BTC. Outflows across all 11 funds. Institutions are reducing positions.
7️⃣ Exchange Flows: Steady outflow throughout March → 🟢 Positive for BTC. Exchange reserves at multi-month lows.
8️⃣ MVRV: ~1.50 → ⚪ Neutral. Market in the middle of the price range.
9️⃣ Whale Inflow Ratio: 0.64 (down from a peak of 0.85 in February; normal 0.35–0.55) → ⚪ Neutral. 80% of exchange deposits come from large wallets, but the trend is downward.
🔟 Top Holders: 270,000 BTC accumulated in 30 days – a 13-year record → 🟢 Positive for BTC. Whales are accumulating.
1️⃣1️⃣ Geopolitics: US/Iran war → 🔴 Negative for BTC. The most significant negative. Potential for a sharp rebound if de-escalation occurs.
Conclusion: 👈🏻 War still determines the movement direction.
1️⃣СCI - above +100, a decline is needed, followed by another upward move. Weak divergence.
2️⃣RSI - around 70. Also advisable to fall first. There's good divergence.
3️⃣Levels:
🔸High volume 3 = 66,460 + a full set of downward waves on h4 = 66,200 - important resistance
🔸61.8% Fibonacci + a full set of upward waves = 69,350 - potential price stop
🔸High volume 1 = 70,750 + 78.6% Fibonacci = 75,000 - approximate take-profit level.
4️⃣Elder TF (h4) - 50 EMA approximately at the increased volume level 2 = 68770. Another potential resistance point on the way up.
5️⃣Price movement forecast - on the chart.
Entry, stop, take:
🔸Entry: Buy. Breakout above the increased volume level 3 = 66460
🔸Stop: Preliminary beyond the peak of 65020, but may be adjusted, depending on the price action.
🔸Take Profit: high volume 1 = 70,750.
🔸Risk/Reward: 3.14
🔸Execution: Within a week.
Cancellation
🔸No breakout of high volume 3 = 66,460 or a sharp drop to 141% Fibonacci level of the large first wave = 64,400
Fundamentals:
1️⃣ Fear Index: 8 (Extreme Fear, ~7 weeks in a row) → 🟢 Positive for BTC. Longest streak of extreme fear since late 2022. A trigger is needed for an upward move.
2️⃣ BTC Dominance: 56–57% → ⚪ Neutral. Capital favors BTC over altcoins (ETH/BTC 0.030 is a multi-year low).
3️⃣ Funding Rate: negative for almost all of March, has turned slightly positive (+0.0003–0.0005%) in the last 16 hours (Binance API) → 🟢 Positive for BTC. A positive funding reversal could signal the beginning of a sentiment shift.
4️⃣ Open Interest: $102–112B, funding has just turned positive (Binance API) → ⚪ Neutral. A positive funding reversal (since March 29) could mean shorts are starting to close or longs are being added.
5️⃣ Liquidations (March 27): $451M, 122K traders → ⚪ Neutral. There are conditions for an upward move, we are waiting for a trigger.
6️⃣ ETF Flows: -$171M (March 27), week ~-$71M, March $890M vs. $3.3B in February → 🔴 Negative for BTC. Outflows across all 11 funds. Institutions are reducing positions.
7️⃣ Exchange Flows: Steady outflow throughout March → 🟢 Positive for BTC. Exchange reserves at multi-month lows.
8️⃣ MVRV: ~1.50 → ⚪ Neutral. Market in the middle of the price range.
9️⃣ Whale Inflow Ratio: 0.64 (down from a peak of 0.85 in February; normal 0.35–0.55) → ⚪ Neutral. 80% of exchange deposits come from large wallets, but the trend is downward.
🔟 Top Holders: 270,000 BTC accumulated in 30 days – a 13-year record → 🟢 Positive for BTC. Whales are accumulating.
1️⃣1️⃣ Geopolitics: US/Iran war → 🔴 Negative for BTC. The most significant negative. Potential for a sharp rebound if de-escalation occurs.
Conclusion: 👈🏻 War still determines the movement direction.

Verbundene Veröffentlichungen
Haftungsausschluss
Die Informationen und Veröffentlichungen sind nicht als Finanz-, Anlage-, Handels- oder andere Arten von Ratschlägen oder Empfehlungen gedacht, die von TradingView bereitgestellt oder gebilligt werden, und stellen diese nicht dar. Lesen Sie mehr in den Nutzungsbedingungen.
Verbundene Veröffentlichungen
Haftungsausschluss
Die Informationen und Veröffentlichungen sind nicht als Finanz-, Anlage-, Handels- oder andere Arten von Ratschlägen oder Empfehlungen gedacht, die von TradingView bereitgestellt oder gebilligt werden, und stellen diese nicht dar. Lesen Sie mehr in den Nutzungsbedingungen.