
Good day, everyone! Let’s dive into today's Bitcoin update.
To briefly summarize the higher timeframes, as we discussed in detail two days ago, both the monthly and weekly charts remain bearish. Tomorrow, once the weekly candle closes, we will perform another top-down analysis starting from the higher timeframes.
Daily Timeframe
Yesterday's daily candle doesn't provide much actionable information in my opinion. It printed a small lower shadow, a moderate upper shadow, and a medium-sized green body. To me, this candle mostly reflects market indecision.
4-Hour & 1-Hour Timeframes
Let's drop down to the 4-hour chart to get a clearer view of the current price action. On the 4-hour timeframe, price attempted to push up aggressively with a strong bullish leg to break its last swing high. However, since it was Friday—the final trading day of the week for traditional markets—it wasn't the ideal day for a breakout. Price ended up getting stuck as it reacted to that 4-hour high.
Given that global markets are closed over the weekend, crypto market volume naturally dries up. Therefore, we shouldn't expect any major moves from Bitcoin between today and tomorrow evening, unless a sudden, high-impact news event drops.
Regardless, let’s review our entry triggers once more:
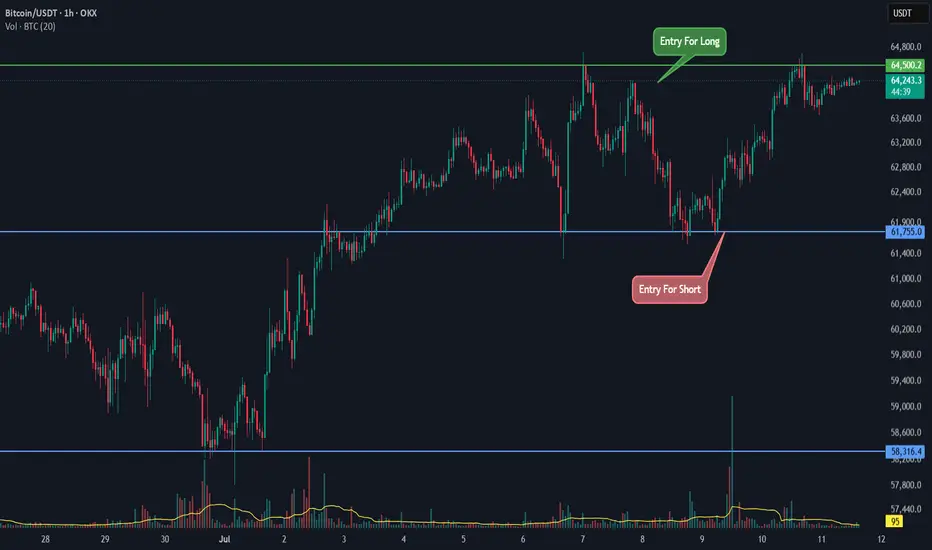
Long Scenario: Yesterday, we were waiting for a reaction to the $64,500 resistance line, and we are seeing that play out now. If price manages to close a candle above the $64,500 resistance on strong volume, I will open a long position. If the current market structure and the last 1-hour higher low remain as they are, I will place my stop loss just below $63,600.
Short Scenario: For shorts, I’m looking at two potential setups. First, if price gets rejected from current levels or turns the breakout of this resistance into a fakeout and aggressively reverses, I will trigger a short position upon a confirmed breakout below the $61,755 support. Second, if price consolidates right below $64,500 and forms a tight 4-hour trading range (box), I will look to enter a short position on a 1-hour breakdown of that range's floor.
I hope you enjoyed today's analysis and find it useful. As always, make sure to keep your risk and money management in check!
To briefly summarize the higher timeframes, as we discussed in detail two days ago, both the monthly and weekly charts remain bearish. Tomorrow, once the weekly candle closes, we will perform another top-down analysis starting from the higher timeframes.
Daily Timeframe
Yesterday's daily candle doesn't provide much actionable information in my opinion. It printed a small lower shadow, a moderate upper shadow, and a medium-sized green body. To me, this candle mostly reflects market indecision.
4-Hour & 1-Hour Timeframes
Let's drop down to the 4-hour chart to get a clearer view of the current price action. On the 4-hour timeframe, price attempted to push up aggressively with a strong bullish leg to break its last swing high. However, since it was Friday—the final trading day of the week for traditional markets—it wasn't the ideal day for a breakout. Price ended up getting stuck as it reacted to that 4-hour high.
Given that global markets are closed over the weekend, crypto market volume naturally dries up. Therefore, we shouldn't expect any major moves from Bitcoin between today and tomorrow evening, unless a sudden, high-impact news event drops.
Regardless, let’s review our entry triggers once more:
Long Scenario: Yesterday, we were waiting for a reaction to the $64,500 resistance line, and we are seeing that play out now. If price manages to close a candle above the $64,500 resistance on strong volume, I will open a long position. If the current market structure and the last 1-hour higher low remain as they are, I will place my stop loss just below $63,600.
Short Scenario: For shorts, I’m looking at two potential setups. First, if price gets rejected from current levels or turns the breakout of this resistance into a fakeout and aggressively reverses, I will trigger a short position upon a confirmed breakout below the $61,755 support. Second, if price consolidates right below $64,500 and forms a tight 4-hour trading range (box), I will look to enter a short position on a 1-hour breakdown of that range's floor.
I hope you enjoyed today's analysis and find it useful. As always, make sure to keep your risk and money management in check!

Haftungsausschluss
Die Informationen und Veröffentlichungen sind nicht als Finanz-, Anlage-, Handels- oder andere Arten von Ratschlägen oder Empfehlungen gedacht, die von TradingView bereitgestellt oder gebilligt werden, und stellen diese nicht dar. Lesen Sie mehr in den Nutzungsbedingungen.
Haftungsausschluss
Die Informationen und Veröffentlichungen sind nicht als Finanz-, Anlage-, Handels- oder andere Arten von Ratschlägen oder Empfehlungen gedacht, die von TradingView bereitgestellt oder gebilligt werden, und stellen diese nicht dar. Lesen Sie mehr in den Nutzungsbedingungen.