
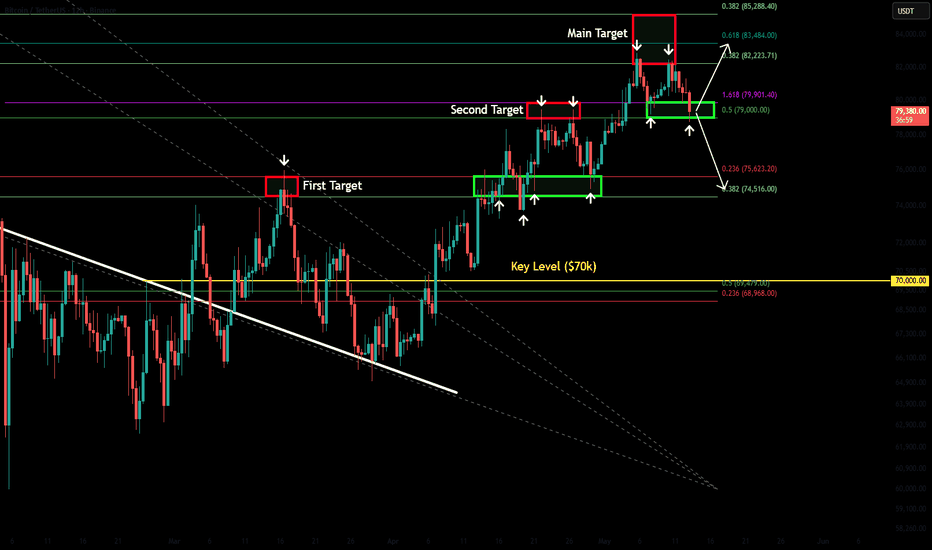
This is an updated look at my last idea:
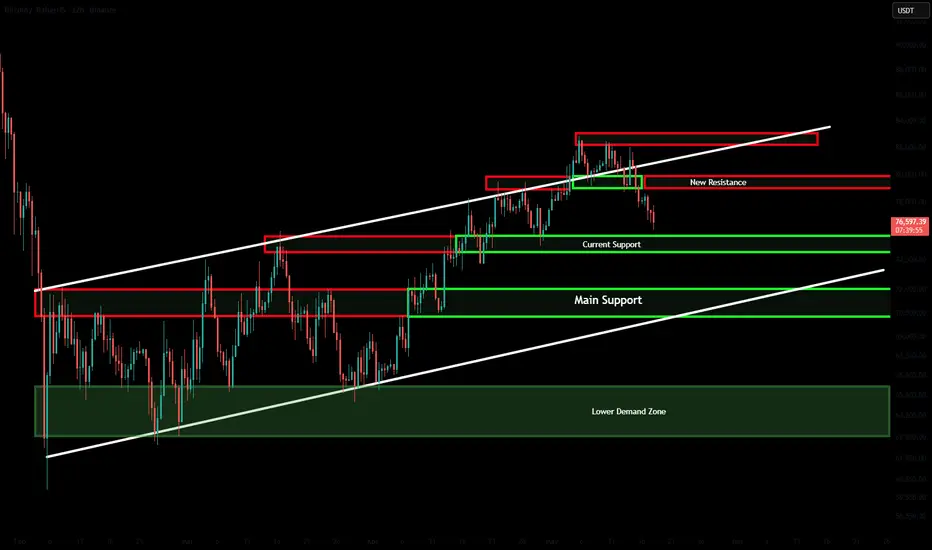
In this chart I have all the important support and resistance zones highlighted. The red boxes represent major resistance or selling areas and the green boxes represent major support or buying levels.
Price recently broke down from a previous support zone which has now flipped into new resistance. Therefore, if price bounces from the current green box, watch that upper red box as the area where sellers will begin to offload again. Alternatively, if price is unable to hold the current green box and flips it into new resistance, the next destination would be the $70,000 to $72,000 level highlighted as the "Main Support."
Another thing worth noting are the two solid white lines representing the rising wedge or bear flag that price has been trading within throughout this entire move up. Now that price is back inside the pattern, BTC should expect a move at some point back to the lower white trendline of support.
What makes this particularly interesting is that this is the second pattern of this type where BTC saw an upside deviation before reclaiming back within the pattern and completing the downside move:

In this chart I have all the important support and resistance zones highlighted. The red boxes represent major resistance or selling areas and the green boxes represent major support or buying levels.
Price recently broke down from a previous support zone which has now flipped into new resistance. Therefore, if price bounces from the current green box, watch that upper red box as the area where sellers will begin to offload again. Alternatively, if price is unable to hold the current green box and flips it into new resistance, the next destination would be the $70,000 to $72,000 level highlighted as the "Main Support."
Another thing worth noting are the two solid white lines representing the rising wedge or bear flag that price has been trading within throughout this entire move up. Now that price is back inside the pattern, BTC should expect a move at some point back to the lower white trendline of support.
What makes this particularly interesting is that this is the second pattern of this type where BTC saw an upside deviation before reclaiming back within the pattern and completing the downside move:

Haftungsausschluss
Die Informationen und Veröffentlichungen sind nicht als Finanz-, Anlage-, Handels- oder andere Arten von Ratschlägen oder Empfehlungen gedacht, die von TradingView bereitgestellt oder gebilligt werden, und stellen diese nicht dar. Lesen Sie mehr in den Nutzungsbedingungen.
Haftungsausschluss
Die Informationen und Veröffentlichungen sind nicht als Finanz-, Anlage-, Handels- oder andere Arten von Ratschlägen oder Empfehlungen gedacht, die von TradingView bereitgestellt oder gebilligt werden, und stellen diese nicht dar. Lesen Sie mehr in den Nutzungsbedingungen.