There are countless indicators available today.
The funny thing is that a simple moving average is still more useful than most of them.
If I were only allowed to keep one indicator for market analysis, I would choose MA200-D without hesitation.
💻 What is MA200-D?
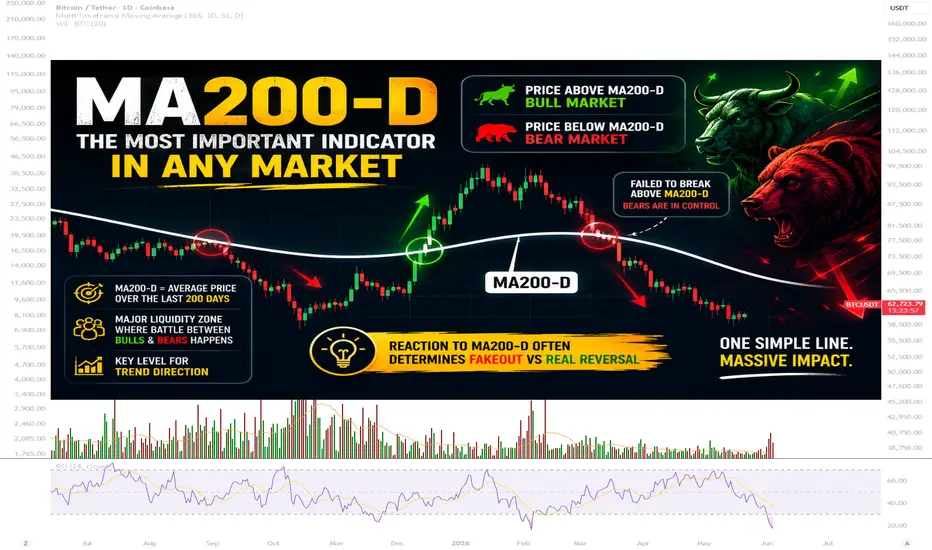
MA200-D is the average price of an asset over the last 200 days. In simple terms, it shows the long-term trend of the market.
The logic is straightforward:
📈 Price above MA200-D → Bull Market
📉 Price below MA200-D → Bear Market
For example, in October 2025, after the MA200-d breakout, the trend completely changed from bullish to bearish.
Since then, we have continued to fall.
Very often during bear markets, price first collapses, then stages a powerful rally back toward MA200-D 📈
That is exactly what happened in early May when #BTC rallied +37%. After testing MA200-D, the market started declining again.
🕯 Why does price return to MA200-D during bear markets?
Because MA200-D attracts enormous amounts of liquidity:
• short sellers place stop losses above it
• investors exit positions at breakeven
• the crowd starts buying the "reversal"
And markets love liquidity 🔪
That is why I mention MA200-D so often in my analysis.
It does not predict the future.
But it does an excellent job of identifying the most important battlefield between bulls and bears.
✔️ Very often, the market's reaction around MA200-D determines whether we're seeing a genuine trend reversal or simply another short squeeze.
If
 BTCUSDT had managed to break and hold above MA200-D, I would have turned bullish very quickly and put all of my bearish scenarios aside.
But until that happens, I continue to view the market through a bearish lens.
_ _ _ _ _ _ _ _
👉 If you want to trade like a professional and not like a gambler — follow for real insights and strategies 🚀
The funny thing is that a simple moving average is still more useful than most of them.
If I were only allowed to keep one indicator for market analysis, I would choose MA200-D without hesitation.
💻 What is MA200-D?
MA200-D is the average price of an asset over the last 200 days. In simple terms, it shows the long-term trend of the market.
The logic is straightforward:
📈 Price above MA200-D → Bull Market
📉 Price below MA200-D → Bear Market
For example, in October 2025, after the MA200-d breakout, the trend completely changed from bullish to bearish.
Since then, we have continued to fall.
Very often during bear markets, price first collapses, then stages a powerful rally back toward MA200-D 📈
That is exactly what happened in early May when #BTC rallied +37%. After testing MA200-D, the market started declining again.
🕯 Why does price return to MA200-D during bear markets?
Because MA200-D attracts enormous amounts of liquidity:
• short sellers place stop losses above it
• investors exit positions at breakeven
• the crowd starts buying the "reversal"
And markets love liquidity 🔪
That is why I mention MA200-D so often in my analysis.
It does not predict the future.
But it does an excellent job of identifying the most important battlefield between bulls and bears.
✔️ Very often, the market's reaction around MA200-D determines whether we're seeing a genuine trend reversal or simply another short squeeze.
If
BTCUSDT had managed to break and hold above MA200-D, I would have turned bullish very quickly and put all of my bearish scenarios aside.But until that happens, I continue to view the market through a bearish lens.
_ _ _ _ _ _ _ _
👉 If you want to trade like a professional and not like a gambler — follow for real insights and strategies 🚀

🤟 Enjoyed this post and want more like it?
✔️ Then join my Telegram
👉 t.me/+1v6UHltC22xlMDdi
_ _ _ _ _
💰 I trade on the BingX 👉 bingx.com/en/partner/cassiustrade
🎁 Welcome bonus up to $10,800 + trading fee discounts
✔️ Then join my Telegram
👉 t.me/+1v6UHltC22xlMDdi
_ _ _ _ _
💰 I trade on the BingX 👉 bingx.com/en/partner/cassiustrade
🎁 Welcome bonus up to $10,800 + trading fee discounts
Verbundene Veröffentlichungen
Haftungsausschluss
Die Informationen und Veröffentlichungen sind nicht als Finanz-, Anlage-, Handels- oder andere Arten von Ratschlägen oder Empfehlungen gedacht, die von TradingView bereitgestellt oder gebilligt werden, und stellen diese nicht dar. Lesen Sie mehr in den Nutzungsbedingungen.
🤟 Enjoyed this post and want more like it?
✔️ Then join my Telegram
👉 t.me/+1v6UHltC22xlMDdi
_ _ _ _ _
💰 I trade on the BingX 👉 bingx.com/en/partner/cassiustrade
🎁 Welcome bonus up to $10,800 + trading fee discounts
✔️ Then join my Telegram
👉 t.me/+1v6UHltC22xlMDdi
_ _ _ _ _
💰 I trade on the BingX 👉 bingx.com/en/partner/cassiustrade
🎁 Welcome bonus up to $10,800 + trading fee discounts
Verbundene Veröffentlichungen
Haftungsausschluss
Die Informationen und Veröffentlichungen sind nicht als Finanz-, Anlage-, Handels- oder andere Arten von Ratschlägen oder Empfehlungen gedacht, die von TradingView bereitgestellt oder gebilligt werden, und stellen diese nicht dar. Lesen Sie mehr in den Nutzungsbedingungen.