
Hello, fellow traders!
Follow us to get the latest information quickly.
Have a great day!
-------------------------------------
The M-Signal indicator on the 1M, 1W, and 1D charts is useful for monitoring the overall chart movement.
A major uptrend occurs when the M-Signal on the 1D chart > M-Signal on the 1W chart > M-Signal on the 1M chart.
Conversely, if the M-Signal on the 1M chart > M-Signal on the 1W chart > M-Signal on the 1D chart, a major downtrend is indicated.
-
The HA-Low and HA-High indicators are used for trading.
Therefore, the basic trading strategy is to buy in the DOM(-60) ~ HA-Low range and sell in the HA-High ~ DOM(60) range.
A rise in the HA-High ~ DOM(60) range is likely to lead to a stepwise uptrend, while a decline in the DOM(-60) ~ HA-Low range is likely to lead to a stepwise downtrend.
Therefore, trading should be done in segmented trading formats.
The HA-Low indicator is currently trending downward, which can be interpreted as a stepwise downward trend.
Since a stepwise downward trend ends in an uptrend, and a stepwise upward trend ends in a downtrend, we should monitor the current trend while preparing for an uptrend.
-
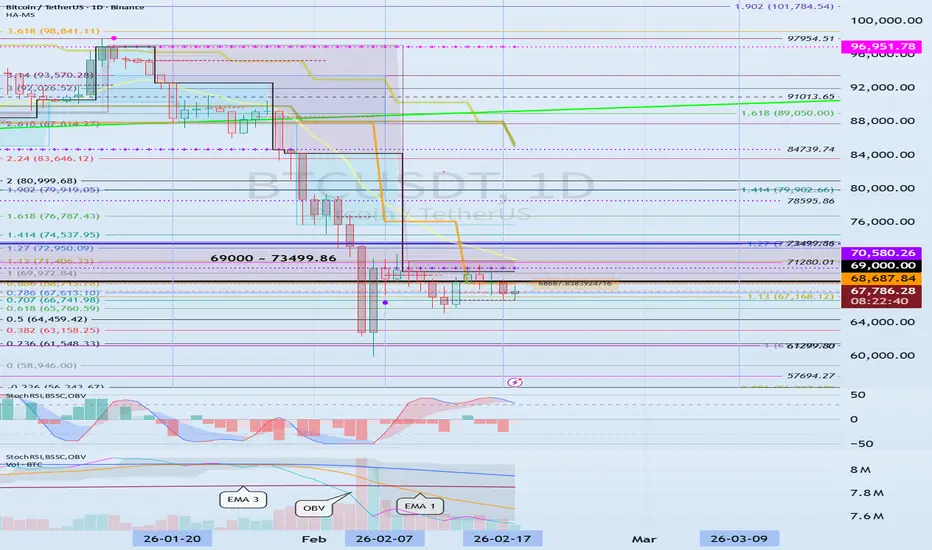
The price is declining in the HA-Low ~ DOM (-60) range (68,687.84 ~ 70,580.26).
Therefore, the key question is whether the price can rise to the 68,687.84 ~ 70,580.26 range.
However,
1. The StochRSI indicator is showing signs of declining from the overbought zone,
2. The BSSC indicator is below zero,
3. The OBV indicator has fallen below the Low Line. Therefore, we should consider a downward trend and consider countermeasures.
We've added the OBV High and OBV Low indicators, which correspond to the High and Low lines of the OBV indicator, to help you intuitively check the current status.
In other words, for an uptrend to continue, the price must remain above the OBV High.
Since the price is currently above the OBV High indicator, we can interpret this as indicating a potential uptrend.
However, since the OBV Low indicator is above it, the price must rise above and remain above the OBV Low indicator to demonstrate an uptrend.
If the price falls below the OBV High indicator, further declines are likely.
Therefore, summarizing the above,
1. To buy, the price must find support in the 68687.84 to 70580.26 range.
2. If not, a step-down trend is likely, and you should consider countermeasures.
3. The start of a step-down trend is likely to begin with a decline below the OBV High indicator.
-
This volatility period is expected to last until February 18th, so movement during this period is crucial.
While it could find support at the OBV High indicator and rise dramatically, this is unlikely.
The next volatility period is around March 9th.
Therefore, we should watch for support and an upward trend around the 57694.27 to 61299.80 range before the next volatility period.
For an uptrend to begin, the StochRSI 20 indicator (75719.90) should provide support.
However, the key to trading is whether the price can buy when it finds support around the critical 69000 to 73499.86 range.
While it's good to buy at a lower price and see the price rise, it's difficult to buy when the actual price touches the 57694.27 to 61299.80 range.
Therefore, it's more likely to buy when the price finds support around 69000 to 73499.86, which meets the conditions for an uptrend.
The next most common buying point is when the price rises above the 75719.90 level, the StochRSI 20 indicator.
This is a psychological phenomenon, so regardless of where you buy, you should develop a trading strategy that suits your investment style.
-
Thank you for reading to the end.
I wish you successful trading.
--------------------------------------------------
Trade ist aktiv
#BTCUSDTDespite the price increase, the BSSC indicator remains below zero.
The HA-Low indicator is expected to form at the 68477.26 level. Therefore, we need to see if the BSSC indicator rises above zero when this level rises.
If the BSSC indicator rises above zero, the first hurdle for a bullish trend has been cleared.
This is because it indicates that buying pressure has taken over.
Even so, the OBV indicator is still near the Low Line and the StochRSI indicator is declining, so it will likely take more time for the bullish trend to reverse.
To halt the cascading downtrend, the price must at least rise above the 68477.26 to 70580.26 range and maintain its position.
Therefore, the uptrend is likely to begin only when it rises above the critical 69,000-73,499.86 level.
Currently, the M-Signal indicator on the 1M chart is hovering around 84,736.74, so a full-blown uptrend will likely begin when it rises above this level.
Therefore, even if the price rises, it seems advisable to trade with a short-term perspective and day trading.
Since the previous volatility period (February 6-8) touched the previous high of 57,694.27-61,299.80, around February 7th, the next volatility period (March 8-10) will likely have a significant impact on the future trend.
If trading volume increases and the price finds support in the 68,477.26 to 70,580.26 range, it's likely to rise after the next period of volatility.
If not, it's likely to touch the previous high of 57,694.27 to 61,299.80 again, so we need to consider how to respond.
We should react based on whether the price finds support or resistance near the 68,477.26 to 70,580.26 range.
If the 68,477.26 to 70,580.26 range provides support, we buy; if it provides resistance, we sell.
All of these trades should be conducted from a day trading perspective.
Take advantage of the coin market's advantage of decimal trading, trading in a way that leaves the number of coins (tokens) corresponding to the profit.
This is because a cascading downtrend ends in an uptrend.
When you truly feel the need to buy, it's likely to happen when the M-Signal indicator on the 1M chart rises above that level. Therefore, before that, increase your holdings by increasing the number of coins (tokens) corresponding to profits. Then, when the price breaks above the previously mentioned critical 73499.86 level, increase your holdings.
A second round of buying is conducted when the price maintains near the M-Signal indicator on the 1M chart.
To increase the number of coins (tokens) corresponding to profits, you should trade at each purchase price, and when selling, you should sell the amount equal to the purchase price.
Anmerkung
1. The price is below the M-Signal indicator on the 1M chart, indicating a downtrend (-1).
2. We should examine whether it finds support near the HA-Low ~ DOM (-60) range and rises.
If it continues to decline, the stepwise downtrend will continue (-1).
3. We should examine whether it finds support near the OBV Low (above the OBV High) and rises. (1).
4. If the StochRSI indicator rises above 80, an uptrend is likely. However, the StochRSI indicator must rise above 20 for an uptrend to begin. If not, the area around the StochRSI 20 indicator may become a resistance zone (-1).
5. The BSSC indicator must remain above 0 for an uptrend to begin (-1).
6. The StochRSI indicator is showing signs of entering an overbought zone, so the uptrend may be limited (1).
7. The OBV indicator is located near the Low Line, so an uptrend may only begin if it rises above the High Line (0).
-
It is ideal to initiate actual trading when the price remains above the M-Signal indicator on the 1M chart.
If trading is conducted while the M-Signal indicator on the 1M chart is below, day trading is recommended.
If support is found near the DOM(-60) ~ HA-Low or HA-Low ~ DOM(-60) range, it is a good time to buy.
The final time to buy is when the price rises, supported by the M-Signal indicator on the 1M chart.
Therefore, after buying, you should consider the position relative to the M-Signal indicator on the 1M chart and respond accordingly.
-
Once you've completed your chart analysis and interpretation, you need to decide on a trading strategy with a specific investment timeframe.
1. Where to buy in installments?
2. Where to cut your losses or buy more?
3. Where to sell in installments and how to take profits after selling.
At this point, it's crucial to maintain your overall strategy.
In other words, don't start a trade with a short-term (day trading) strategy, only to find yourself unable to sell due to a significant drop below your stop loss.
If you change your overall strategy in this way, subsequent trades could go in the wrong direction, leaving you helpless.
If that happens, you will likely end up losing time twice or three times because you will likely miss out on good opportunities when they come.

[Binance Manual Trading Scanner]
binance.readcrypto.kr
[Practical trading strategy using HA-MS and SBOD]
youtu.be/aceN1AttX1Y
binance.readcrypto.kr
[Practical trading strategy using HA-MS and SBOD]
youtu.be/aceN1AttX1Y
Verbundene Veröffentlichungen
Haftungsausschluss
Die Informationen und Veröffentlichungen sind nicht als Finanz-, Anlage-, Handels- oder andere Arten von Ratschlägen oder Empfehlungen gedacht, die von TradingView bereitgestellt oder gebilligt werden, und stellen diese nicht dar. Lesen Sie mehr in den Nutzungsbedingungen.
[Binance Manual Trading Scanner]
binance.readcrypto.kr
[Practical trading strategy using HA-MS and SBOD]
youtu.be/aceN1AttX1Y
binance.readcrypto.kr
[Practical trading strategy using HA-MS and SBOD]
youtu.be/aceN1AttX1Y
Verbundene Veröffentlichungen
Haftungsausschluss
Die Informationen und Veröffentlichungen sind nicht als Finanz-, Anlage-, Handels- oder andere Arten von Ratschlägen oder Empfehlungen gedacht, die von TradingView bereitgestellt oder gebilligt werden, und stellen diese nicht dar. Lesen Sie mehr in den Nutzungsbedingungen.