
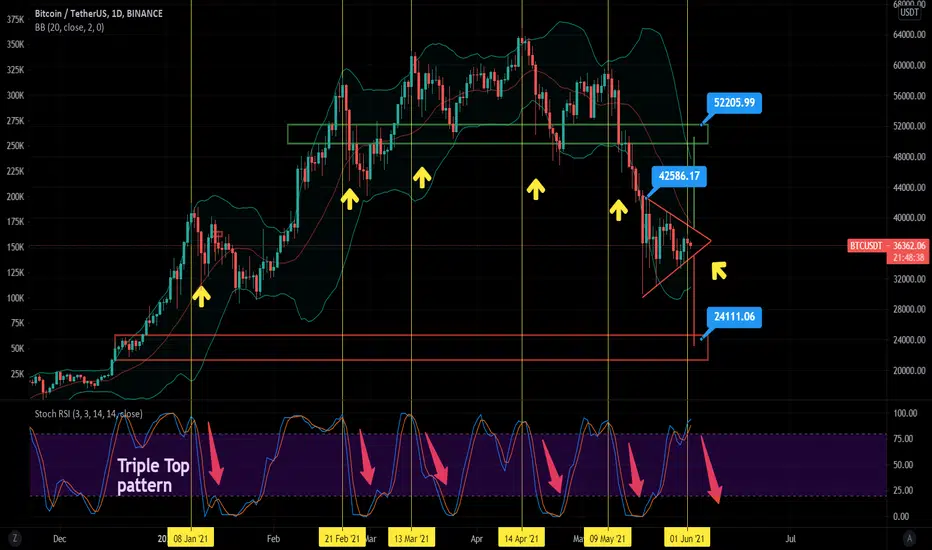
Based on BTC daily chart, it is currently still consolidating in the apex triangle . A breakout to the downside will bring us to a price target of around $24k. Otherwise, breaking to the upside will bring BTC to a price target of around $52k which is unlikely.
Bollinger Band showing a squeeze which indicates a sharp move will come soon.
Stochastic RSI is following my previous prediction where it had a final upward move before heading down. This indicates BTC will have a further correction unless BTC forms a sharp upward move and breaks $42k which will gives a Triple Top Structure in Stochastic RSI pattern(highly unlikely).
Bollinger Band showing a squeeze which indicates a sharp move will come soon.
Stochastic RSI is following my previous prediction where it had a final upward move before heading down. This indicates BTC will have a further correction unless BTC forms a sharp upward move and breaks $42k which will gives a Triple Top Structure in Stochastic RSI pattern(highly unlikely).

Verbundene Veröffentlichungen
Haftungsausschluss
Die Informationen und Veröffentlichungen sind nicht als Finanz-, Anlage-, Handels- oder andere Arten von Ratschlägen oder Empfehlungen gedacht, die von TradingView bereitgestellt oder gebilligt werden, und stellen diese nicht dar. Lesen Sie mehr in den Nutzungsbedingungen.
Verbundene Veröffentlichungen
Haftungsausschluss
Die Informationen und Veröffentlichungen sind nicht als Finanz-, Anlage-, Handels- oder andere Arten von Ratschlägen oder Empfehlungen gedacht, die von TradingView bereitgestellt oder gebilligt werden, und stellen diese nicht dar. Lesen Sie mehr in den Nutzungsbedingungen.