
This is a short to medium term analysis. I invite you to check my last daily chart for more info (tradingview.com/chart/BTCUSDT/0YHr0d74-BTC-Daily-Bearish-divergence-Ichimoku-Rising-wedge/).
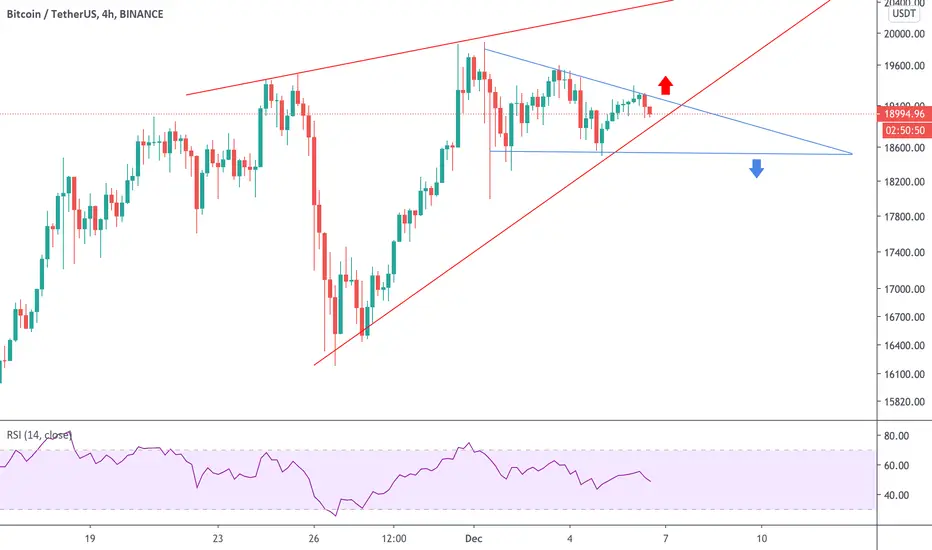
The BTCUSD 4 hour chart shows 2 patterns:
- a rising wedge (in red): would mean we go touch the upper line (20k+), before going south again.
- a descending triangle (in blue): would mean we break the rising wedge and continue bouncing within the blue triangle, and then go south.
Pick your favorite scenario.
Don't guess, follow the price and plan your trade.
The BTCUSD 4 hour chart shows 2 patterns:
- a rising wedge (in red): would mean we go touch the upper line (20k+), before going south again.
- a descending triangle (in blue): would mean we break the rising wedge and continue bouncing within the blue triangle, and then go south.
Pick your favorite scenario.
Don't guess, follow the price and plan your trade.

Haftungsausschluss
Die Informationen und Veröffentlichungen sind nicht als Finanz-, Anlage-, Handels- oder andere Arten von Ratschlägen oder Empfehlungen gedacht, die von TradingView bereitgestellt oder gebilligt werden, und stellen diese nicht dar. Lesen Sie mehr in den Nutzungsbedingungen.
Haftungsausschluss
Die Informationen und Veröffentlichungen sind nicht als Finanz-, Anlage-, Handels- oder andere Arten von Ratschlägen oder Empfehlungen gedacht, die von TradingView bereitgestellt oder gebilligt werden, und stellen diese nicht dar. Lesen Sie mehr in den Nutzungsbedingungen.