
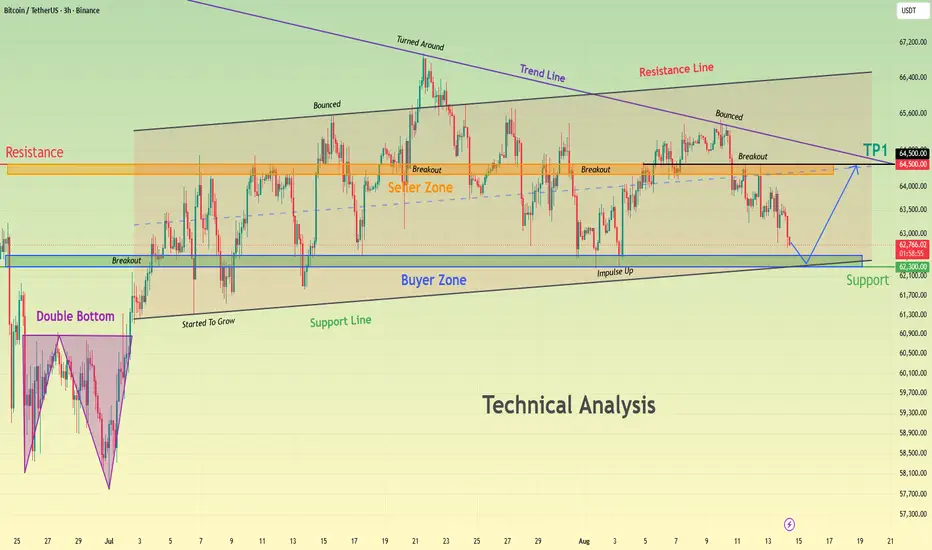
Hello traders! Here’s my technical outlook based on the current BTCUSDT (3H) chart structure. BTCUSDT previously formed a Double Bottom before breaking above the 62,300 Support Zone and moving higher. Price then developed a broad range between the 62,300 Buyer Zone and 64,500 Seller Zone, while respecting the ascending support line. Currently, BTCUSDT is trading below the 64,500 Seller Zone while approaching the 62,300 Buyer Zone and rising support line. The recent decline suggests a short-term pullback, but buyers may defend this area. As long as BTCUSDT remains above the 62,300 Buyer Zone and ascending support line, the bullish scenario remains valid. A rebound from current levels could push price back toward the 64,500 Seller Zone (TP1). However, a breakdown below 62,300 and the ascending support line would weaken the bullish outlook and increase the risk of further downside. Please share this idea with your friends and click "Boost" 🚀

🔷Join my telegram channel for free - bit.ly/4g4wovR
💰Want receive more profitable signals for Crypto & Forex market, write me PM 👉 bit.ly/4fNijD8
💰Want receive more profitable signals for Crypto & Forex market, write me PM 👉 bit.ly/4fNijD8
Haftungsausschluss
Die Informationen und Veröffentlichungen sind nicht als Finanz-, Anlage-, Handels- oder andere Arten von Ratschlägen oder Empfehlungen gedacht, die von TradingView bereitgestellt oder gebilligt werden, und stellen diese nicht dar. Lesen Sie mehr in den Nutzungsbedingungen.
🔷Join my telegram channel for free - bit.ly/4g4wovR
💰Want receive more profitable signals for Crypto & Forex market, write me PM 👉 bit.ly/4fNijD8
💰Want receive more profitable signals for Crypto & Forex market, write me PM 👉 bit.ly/4fNijD8
Haftungsausschluss
Die Informationen und Veröffentlichungen sind nicht als Finanz-, Anlage-, Handels- oder andere Arten von Ratschlägen oder Empfehlungen gedacht, die von TradingView bereitgestellt oder gebilligt werden, und stellen diese nicht dar. Lesen Sie mehr in den Nutzungsbedingungen.