
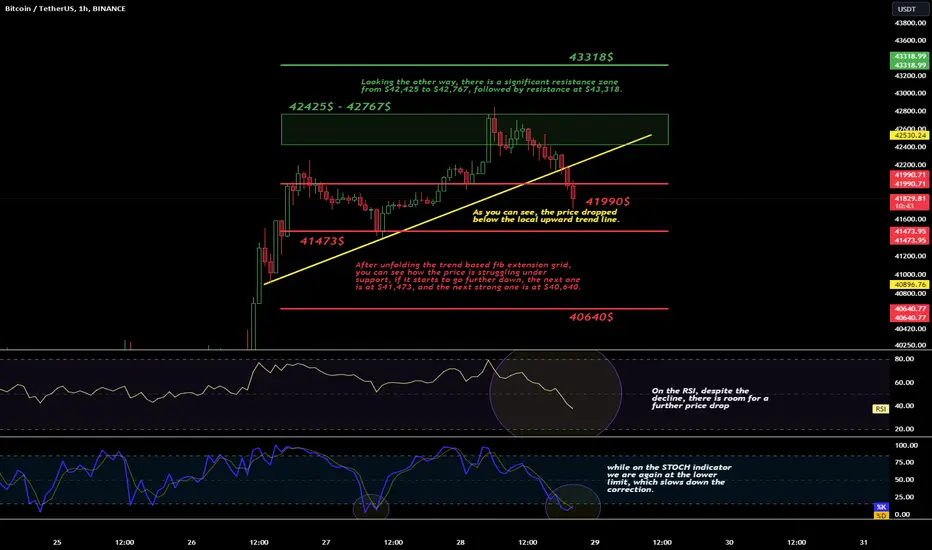
Hello everyone, I invite you to a quick review of BTC on an hourly basis. As you can see, the price dropped below the local upward trend line.
After unfolding the trend based fib extension grid, you can see how the price is struggling under support, if it starts to go further down, the next one is at $41,473, and the next strong one is at $40,640.
Looking the other way, there is a significant resistance zone from $42,425 to $42,767, followed by resistance at $43,318.
On the RSI, despite the decline, there is room for a further price drop, while on the STOCH indicator we are again at the lower limit, which slows down the correction.
After unfolding the trend based fib extension grid, you can see how the price is struggling under support, if it starts to go further down, the next one is at $41,473, and the next strong one is at $40,640.
Looking the other way, there is a significant resistance zone from $42,425 to $42,767, followed by resistance at $43,318.
On the RSI, despite the decline, there is room for a further price drop, while on the STOCH indicator we are again at the lower limit, which slows down the correction.

Haftungsausschluss
Die Informationen und Veröffentlichungen sind nicht als Finanz-, Anlage-, Handels- oder andere Arten von Ratschlägen oder Empfehlungen gedacht, die von TradingView bereitgestellt oder gebilligt werden, und stellen diese nicht dar. Lesen Sie mehr in den Nutzungsbedingungen.
Haftungsausschluss
Die Informationen und Veröffentlichungen sind nicht als Finanz-, Anlage-, Handels- oder andere Arten von Ratschlägen oder Empfehlungen gedacht, die von TradingView bereitgestellt oder gebilligt werden, und stellen diese nicht dar. Lesen Sie mehr in den Nutzungsbedingungen.