
Hi Guys,
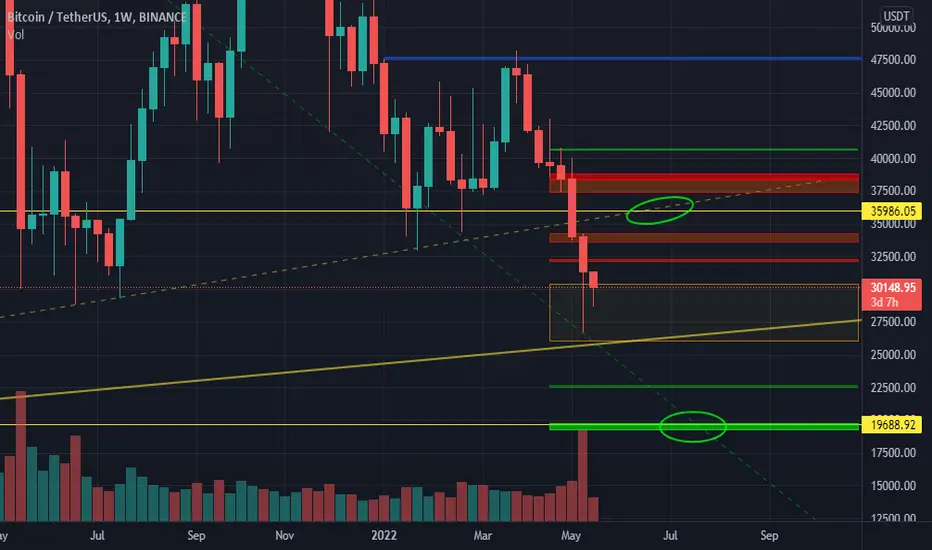
This is a schematic view on mid/long term support/resistance zones in Bitcoin.
those two green circles are highly attractive zones, price might move in a pattern to touch them. so it might give you some hints about the timing analysis.
the yellow line on current zone is very important and make sure you won't ignore it.
for a better understanding, check the post below, related to ETH.

Verbundene Veröffentlichungen
Haftungsausschluss
Die Informationen und Veröffentlichungen sind nicht als Finanz-, Anlage-, Handels- oder andere Arten von Ratschlägen oder Empfehlungen gedacht, die von TradingView bereitgestellt oder gebilligt werden, und stellen diese nicht dar. Lesen Sie mehr in den Nutzungsbedingungen.