
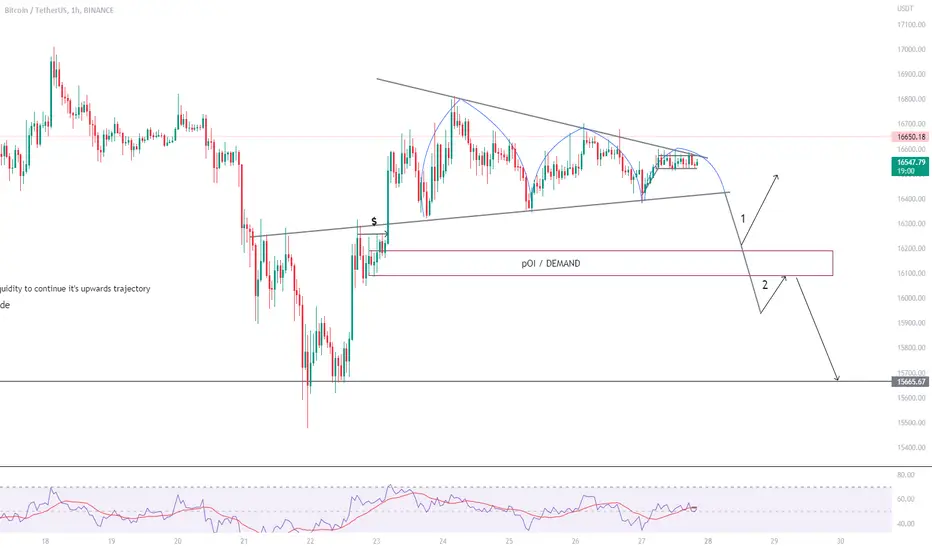
1- The triple top is a chart pattern used in technical analysis to predict a reversal in the price movement of an asset. A triple top indicates that the asset is no longer rallying and that lower prices are expected.
2- We have a level of demand below it, so the price must come to that level and have a big bounce to continue rising.
3- In scenario 2, the price will break the demand, retest it, and then continue to the lower resistance, where it will consolidate, then reach the 12 k area due to market fear.
2- We have a level of demand below it, so the price must come to that level and have a big bounce to continue rising.
3- In scenario 2, the price will break the demand, retest it, and then continue to the lower resistance, where it will consolidate, then reach the 12 k area due to market fear.

Haftungsausschluss
Die Informationen und Veröffentlichungen sind nicht als Finanz-, Anlage-, Handels- oder andere Arten von Ratschlägen oder Empfehlungen gedacht, die von TradingView bereitgestellt oder gebilligt werden, und stellen diese nicht dar. Lesen Sie mehr in den Nutzungsbedingungen.
Haftungsausschluss
Die Informationen und Veröffentlichungen sind nicht als Finanz-, Anlage-, Handels- oder andere Arten von Ratschlägen oder Empfehlungen gedacht, die von TradingView bereitgestellt oder gebilligt werden, und stellen diese nicht dar. Lesen Sie mehr in den Nutzungsbedingungen.